INCONSISTENT yields across a paddock, coupled with a changing climate and declining commodity terms of trade, are prompting Western Australian grain growers to seek new and innovative approaches to managing crop inputs according to soil variation.
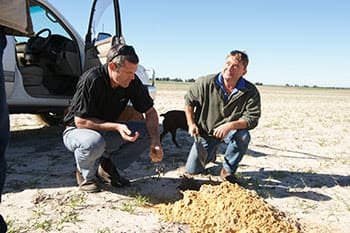
Planfarm consultant Richard Quinlan, left, and Agrarian Management consultant Craig Topham are involved in GRDC-funded research into precision agriculture tools. Photo: Ben White, Kondinin Group.
CSIRO research has found yield monitoring typically picks up big fluctuations in grain yields – ranging by a factor of 10 from about 0.4 tonnes per hectare to 4t/ha – across a single paddock.
A blanket approach to input application can result in low-yielding areas of paddocks receiving too much fertiliser or lime and high-yielding areas being under-fertilised or limed.
It is typically more efficient and economic to adjust input rates according to the potential yield for each part of the paddock, or crop ‘zone’, based on its soil type/properties.
A suite of regionally-specific research projects across WA is investigating practical and profitable ways to identify and set up crop zone areas – or ‘prescription’ maps – for variable rate input application and crop management.
These projects have been initiated by the Grains Research and Development Corporation’s (GRDC) and its Regional Cropping Solutions Networks (RCSN) groups.
The Kwinana West RCSN group supported research near Dowerin in 2015 that found using a range of soil and mapping and information layers for variable rate technology (VRT) application in seasons typical of that year could potentially:
- Save $14-$18.50/ha in input costs
- Increase grain yields worth $18-$24/ha
- Boosts profits by about $38/ha.
A separate, but related, project supported by the Geraldton port zone RCSN in 2014 also investigated the performance of electromagnetic induction (EMI) – known as dual-EM or EM38 – and Gamma-ray (γ-ray) spectrometry in mapping for PA systems.
The aim of this project was to compare the results of paddock zones independently generated using EM38 and Gamma-ray spectroscopy with zones generated utilising only available information layers (for example, yield maps and grower knowledge).
It included measuring yield responses to help find the most economic and effective methods of mapping soil variations for targeted PA and VRT systems.
In the past three years, GRDC has contracted the South East Premium Wheat Growers Association (SEPWA) to deliver a State-wide ‘Do it Yourself Precision Agriculture (DIY-PA)’ project that finished in December 2016.
This explored low cost methods and technologies for practical implementation of PA by growers and advisers, provided hands-on PA training and resources and has resulted in a manual to help growers set up on-farm trials using PA tools.
The project focused on using PA to solve specific agronomy problems and measure returns on inputs for overall profitability.
Background – soil sensing techniques
EMI and γ-ray spectrometry are proximal soil sensing techniques commonly used in WA to measure variation in physical soil properties.
These provide high resolution, non-invasive and relatively cheap information about soil variation. Other data, such as soil test results, yield information and biomass imagery can then be combined into the PA system to help determine zones for the best use of crop inputs.
EMI can measure apparent soil electrical conductivity (ECa), which can be used to estimate soil properties such as plant available soil water storage capacity (PAWC), clay content, salt concentration and soil depth to hardpan at high spatial resolution.
Emissions from naturally occurring radio-isotopes of K, uranium (U) and thorium (Th) found in the soil are measured by γ-ray spectrometry. It has been used to estimate contents of clay, K, C, iron (Fe), soil depth and soil pH where relationships exist.
Precision SoilTech technical manager Wes Lefroy, who led the 2015 Geraldton port zone RCSN PA project, says the accuracy of proximal sensing to predict chemical soil properties relies on the strength of the relationship between the physical soil properties (sensed by the proximal sensing) and the chemical soil properties (observed by laboratory measurements).
In cases where the physical and chemical correlations are poor, he says proximal sensing techniques – such as EM38 and y-ray – will be limited in capacity to accurately predict soil chemical properties, such as soil pH.
Mr Lefroy said this meant the use of these tools would continue to rely on direct soil sampling/surveys to calibrate the sensing data with actual soil chemical measures.
He said to accurately calibrate EM38 and y-ray data, variation in each of the layers needed to be targeted for soil testing.
Setting up paddock maps and zones
Mr Lefroy said generating high resolution soil (or paddock zone) maps for PA using direct grid soil sampling and laboratory analysis of results is time consuming and expensive compared to using sensing methods.
The aims of the 2015 Geraldton RCSN project were to build on limited knowledge about the performance of EM38 and γ-ray spectrometry data for helping to map soils in this port zone and analyse crop biomass and yield results.
Precision SoilTech conducted ‘ground truthing’ to understand the benefits and accuracy of using these sensing tools when mapping soil variability.
Five 50ha sites were set up, from Binnu to Yandanooka, and soil samples were collected in 100m intervals across the paddock in 10cm increments to a depth of 50cm.
Biomass imagery was supplied by Landgate, at a 30-metre resolution in spring 2015 and yield data was supplied by the grower.
Key findings from this project included:
- Relationships between proximally sensed layers, chemical soil properties and physical soil properties were widely variable across the soil profiles of each site
- It was difficult to use a single sensing layer to map a particular soil characteristic (chemical or physical)
- As expected, sites with high sand content (Yuna and West Mingenew) had a comparatively very low EMI response
- Sites with a relatively high clay content (Yandanooka, Tardun and Binnu) had a higher EMI response
- Different soil types had a varying gamma K response, irrespective of Colwell K soil test result.
Mr Lefroy said the soil maps created using a low resolution of soil sampling data provided minimal accurate information about actual soil properties, which in turn led to inaccurate input prescriptions for paddock zones.
He said due to the significant variation in the relationships between proximal layers and soil chemical properties, it was impossible to provide a basis for fertiliser recommendations across all sites. Relationships would need to be analysed on a soil type-by-soil type basis.
The project found yield and biomass are important to use in supplementary mapping methods.
But Mr Lefroy said because there were so many factors contributing to yield variations, it was difficult to define a particular rule, procedure or basis for creating input recommendations directly from yield or biomass imagery.
He said the best bet for setting up high quality maps of soil variation was to have as much soil test data as possible, along with yield maps, biomass imagery, satellite imagery or farmer identified soil zones.
Economics of mapping for VRT application of inputs
Mr Lefroy said in some cases, losses from a poor application of inputs were estimated to be more than $2000 across a 50ha area.
The Kwinana West port zone RCSN group trial at Dowerin in 2015 found that in seasonal conditions that year:
- On a three to 10-year amortised basis, the cost of determining mapping zones was $2-$4.50/ha
- Input savings were between $14.30 and $18.50/ha, including or excluding the use of the EM38 and γ-ray layers respectively
- Yield response curves showed benefits worth $18.90-$23.80/ha with appropriately-placed inputs.
But in seasons where moisture was the limiting factor, these figures could be significantly reduced, according to project coordinator Ben White, of the Kondinin Group.
He said the project showed the pay-back from setting up VRT zones would depend on the level of mapping used and existing paddock knowledge of the grower.
This trial used PA and VRT strategies derived by consultants Frank D’Emden, of PAA, and Richard Quinlan, of Planfarm Pty Ltd – compared to a blanket application with no VRT.
Each consultant collected and processed: visual data layers; soil coring, yield and elevation data; biomass imagery; and farmer knowledge for the site.
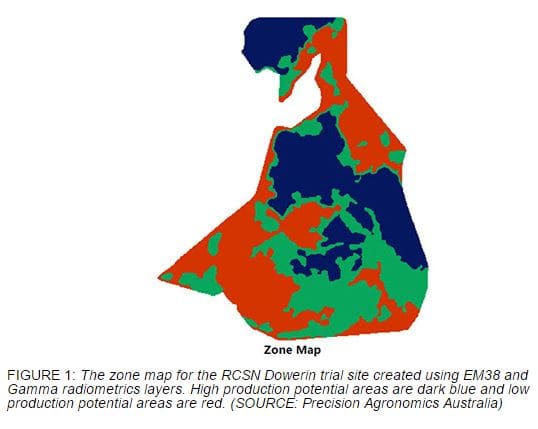
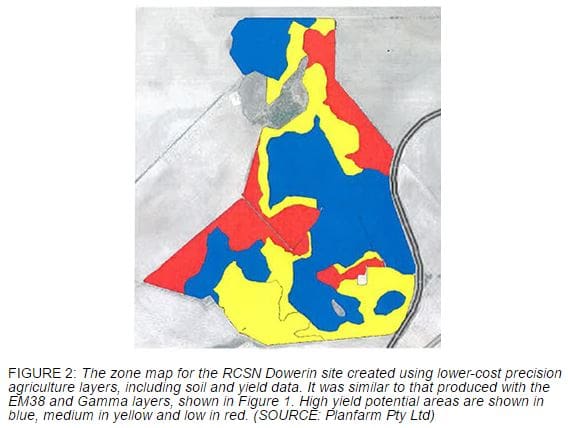
Mr D’Emden generated his production zone input ‘prescription’ maps with the addition of EMI – using dual-EM or EM38 – and Gamma radiometric measurements. Richard did not use these extra layers.
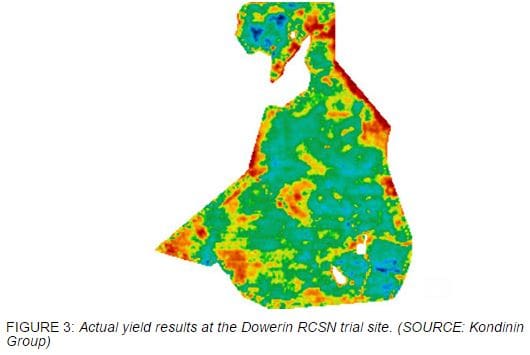
The trial found the zones created by both consultants for the site were highly-correlated, as shown in Figures 1 and 2, and closely matched the actual yield results, shown in Figure 3.
Mr White said the project highlighted that if growers already had good quality historical yield and soil data, they might not need to incur the initial costs of doing EM and Gamma radiometrics surveys to reap the rewards of VRT adoption for crop zones.
But he said without a significant depth of reliable information and paddock knowledge, undertaking these surveys might be highly valuable to start setting up zones for VRT – particularly for soil amelioration.
This RCSN project followed similar RCSN-supported trials near Dowerin, Mingenew, Carnamah and Coorow in 2014.
Further results from these (and more) WA trials are on the RCSN website via this link and a GRDC YouTube video outlining project background can be found via this link.
Source: GRDC


HAVE YOUR SAY