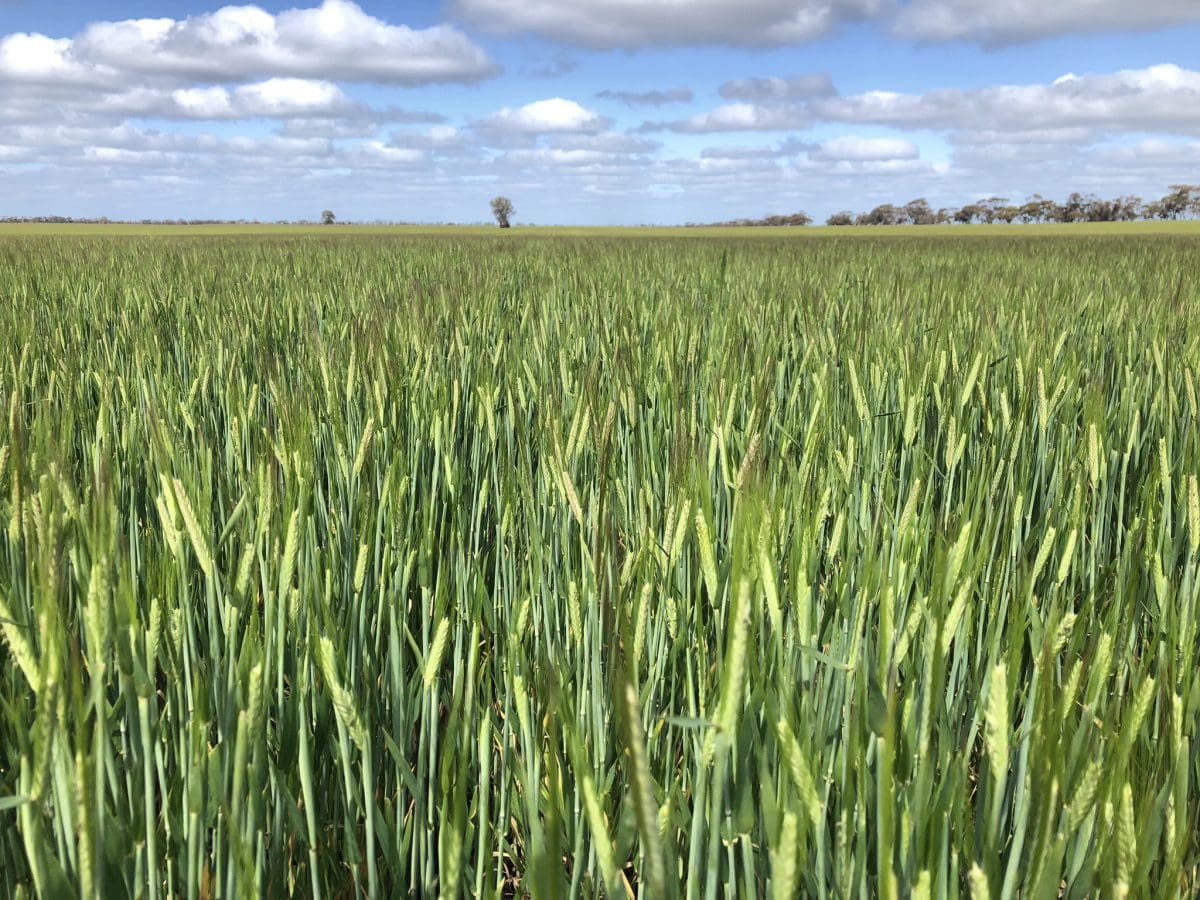
A crop of Spartacus barley growing near the Victoria-NSW border. Photo: Matt Witney, Dodgshun Medlin
ABARES has lifted its new-crop estimate for wheat, barley and canola to 28.9 million tonnes (Mt), 11.2Mt and 3.4Mt respectively in its Australian crop report – September 2020 released today.
Australia’s national commodity forecaster said the increases have come on the back of mostly favourable seasonal growing conditions for the winter crop in New South Wales, Victoria and Western Australia.
On wheat, that represents on increase of 8 per cent from 26.7Mt forecast in ABARES previous crop report issued in June with initial production and area estimates, while barley is up 6pc from 10.6Mt, and canola is up 5pc from 3.2Mt.
This has more than offset cuts to production in Queensland and Tasmania, and unchanged estimates in South Australia.
Harvesting of new-crop wheat wheat and barley has started in small amounts in Queensland, and will gather pace next month when the harvest gets going in other states.
ABARES wheat number sits above the most recent forecasts released by Lachstock Consulting on 28.2Mt and Australian Crop Forecasters (ACF) on 27.9Mt, both of which exclude the Tasmanian crop in their national figures.
Lachstock is sitting on 9.9Mt for barley and 3Mt for canola, while ACF is at 10Mt and 3.6Mt.
Tables below refer to crops planted in the year to 31 March.
| WHEAT | 5yr avg to 2019-20 | 2019-20 | 2020-21 Jun estimate | 2020-21 Sep estimate |
| Qld | 885,000 | 420,000 | 1,400,000 | 1,103,000 |
| NSW | 5,072,000 | 2,090,000 | 8,288,000 | 10,260,000 |
| Vic | 3,208,000 | 3,600,000 | 3,831,000 | 4,096,000 |
| Tas | 49,000 | 55,000 | 55,000 | 51,000 |
| SA | 4,018,000 | 3,200,000 | 4,500,000 | 4,500,000 |
| WA | 8,327,000 | 5,800,000 | 8,600,000 | 8,900,000 |
| TOTAL TONNES | 21,559,000 | 15,165,000 | 26,674,000 | 28,910,000 |
Table 1: Tonnes of wheat produced in all Australian states, including initial and revised new-crop estimates. Source: ABARES
| WHEAT | 5yr avg to 2019-20 | 2019-20 | 2020-21 Jun estimate | 2020-21 Sep estimate |
| Qld | 538,000 | 400,000 | 900,000 | 750,000 |
| NSW | 2,651,000 | 1,900,000 | 3,700,000 | 3,800,000 |
| Vic | 1,419,000 | 1,450,000 | 1,575,000 | 1,600,000 |
| Tas | 9,000 | 10,000 | 10,000 | 10,000 |
| SA | 1,939,000 | 1,950,000 | 2,050,000 | 2,075,000 |
| WA | 4,444,000 | 4,500,000 | 4,750,000 | 4,750,000 |
| TOTAL HECTARES | 11,000,000 | 10,210,000 | 12,985,000 | 12,985,000 |
Table 2: Hectares planted to wheat in all Australian states, including initial and revised new-crop estimates. Source: ABARES
| BARLEY | 5yr avg to 2019-20 | 2019-20 | 2020-21 Jun estimate | 2020-21 Sep estimate |
| Qld | 238,000 | 60,000 | 280,000 | 270,000 |
| NSW | 1,654,000 | 696,000 | 2,034,000 | 2,518,000 |
| Vic | 2,027,000 | 2,500,000 | 2,213,000 | 2,349,000 |
| Tas | 28,000 | 45,000 | 32,000 | 30,000 |
| SA | 2,009,000 | 1,850,000 | 2,100,000 | 2,100,000 |
| WA | 3,958,000 | 3,850,000 | 3,900,000 | 3,950,000 |
| TOTAL TONNES | 9,914,000 | 9,001,000 | 10,559,000 | 11,217,000 |
Table 3: Tonnes of barley produced in all Australian states, including initial and revised new-crop estimates. Source: ABARES
| BARLEY | 5yr avg to 2019-20 | 2019-20 | 2020-21 Jun estimate | 2020-21 Sep estimate |
| Qld | 107,000 | 45,000 | 140,000 | 135,000 |
| NSW | 807,000 | 580,000 | 900,000 | 950,000 |
| Vic | 869,000 | 820,000 | 870,000 | 870,000 |
| Tas | 7,000 | 10,000 | 7,000 | 7,000 |
| SA | 869,000 | 845,000 | 840,000 | 840,000 |
| WA | 1,651,000 | 1,750,000 | 1,600,000 | 1,600,000 |
| TOTAL HECTARES | 4,310,000 | 4,050,000 | 4,357,000 | 4,402,000 |
Table 4: Hectares planted to barley in all Australian states, including initial and revised new-crop estimates. Source: ABARES
| CANOLA | 5yr avg to 2019-20 | 2019-20 | 2020-21 Jun estimate | 2020-21 Sep estimate |
| Qld | 1,000 | 1,000 | 1,000 | 1,000 |
| NSW | 713,000 | 225,000 | 803,000 | 869,000 |
| Vic | 604,000 | 650,000 | 712,000 | 765,000 |
| Tas | 3,000 | 3,000 | 2,000 | 2,000 |
| SA | 296,000 | 300,000 | 330,000 | 330,000 |
| WA | 1,519,000 | 1,150,000 | 1,400,000 | 1,450,000 |
| TOTAL TONNES | 3,136,000 | 2,329,000 | 3,248,000 | 3,417,000 |
Table 5: Tonnes of canola produced in all Australian states, including initial and revised new-crop estimates. Source: ABARES
| CANOLA | 5yr avg to 2019-20 | 2019-20 | 2020-21 estimate | 2020-21 estimate |
| Qld | 1,000 | 2,000 | 2,000 | 2,000 |
| NSW | 574,000 | 250,000 | 550,000 | 550,000 |
| Vic | 389,000 | 385,000 | 450,000 | 450,000 |
| Tas | 1,000 | 1,000 | 1,000 | 1,000 |
| SA | 199,000 | 220,000 | 225,000 | 225,000 |
| WA | 1,211,000 | 950,000 | 1,150,000 | 1,150,000 |
| TOTAL HECTARES | 2,375,000 | 1,808,000 | 2,378,000 | 2,378,000 |
Table 6: Hectares planted to canola in all Australian states, including initial and revised new-crop estimates. Source: ABARES
Grain Central: Get our free daily cropping news straight to your inbox – Click here


HAVE YOUR SAY