Every five years the Australian Bureau of Statistics conducts a census of Australian farmers to gain a more accurate picture of the size and nature of Australia’s agricultural sector.
In 2015-16 data was collected from around 104,000 farm businesses with an estimated value of agricultural operations of $40,000 or above.
Results from the five-yearly census, released this morning, include:
Click on images to view in larger format
Wheat
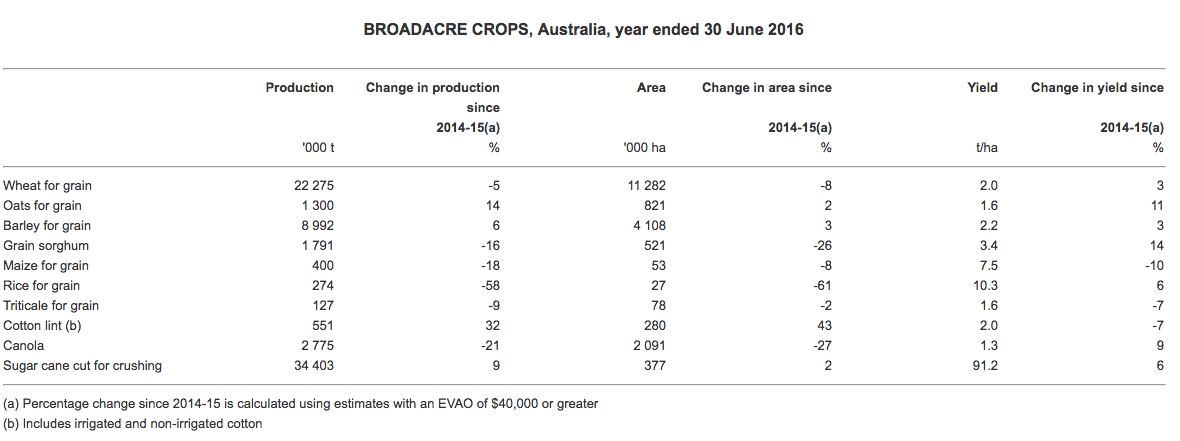
- Wheat production fell by 5pc to 22 million tonnes in 2015-16.
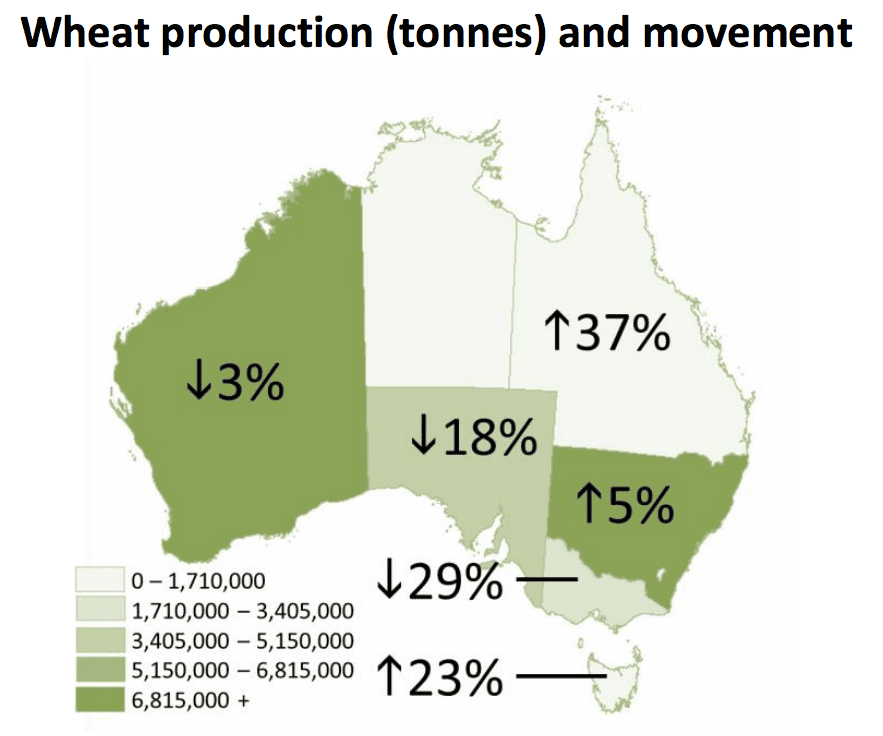
- Warm, dry conditions in Southern Australia, particularly in South Australia (down 18pc), Victoria (down 29pc) and areas of Western Australia (down 3pc), saw large decreases in production.
- The area planted to wheat nationally decreased by 8pc, down to 11 million hectares, with all states except TAS showing a decrease.
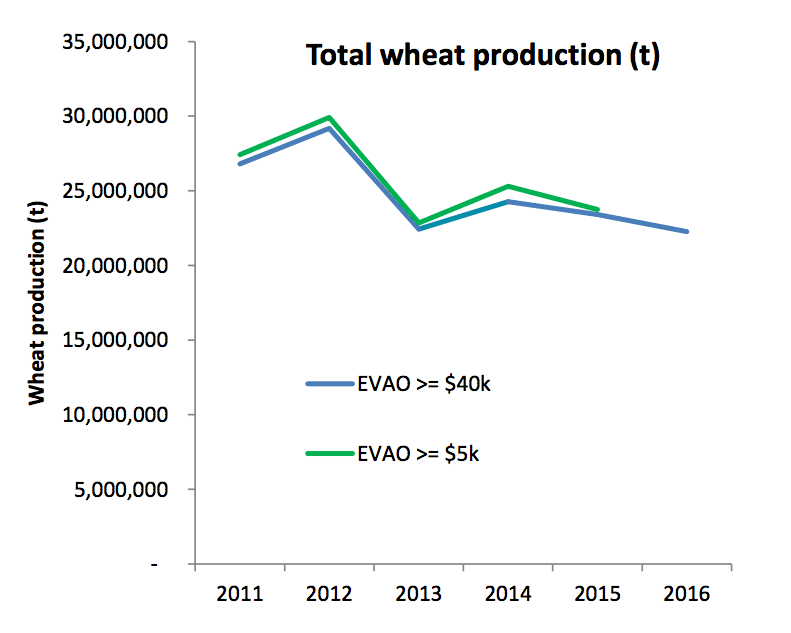
- National wheat production declined from 23,401,783 tonnes in 2014-15 to 22,274,514 tonnes in 2015-16, a decrease of 5pc.
- The gross value (GV) of wheat declined by 12pc to $6.2 billion, its lowest level in recent years, partially due to a 5pc decline in production compared with 2014-15.
- In 2015-16 South Australia experienced the greatest year on year reduction in Gross Value for wheat down by 28pc to $927.2m.
- Western Australia accounted for 38pc of Australia’s wheat production in 2015-16, followed by New South Wales (31pc) and South Australia (17pc).
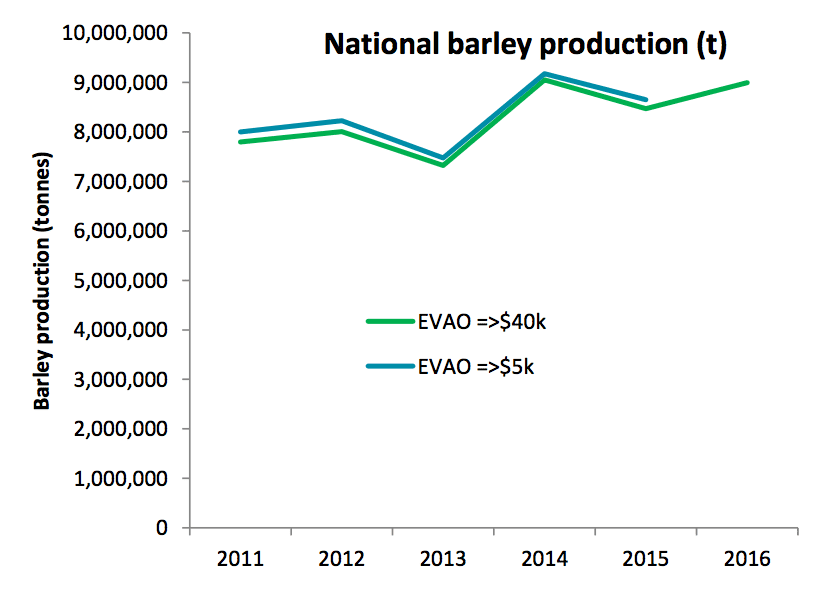
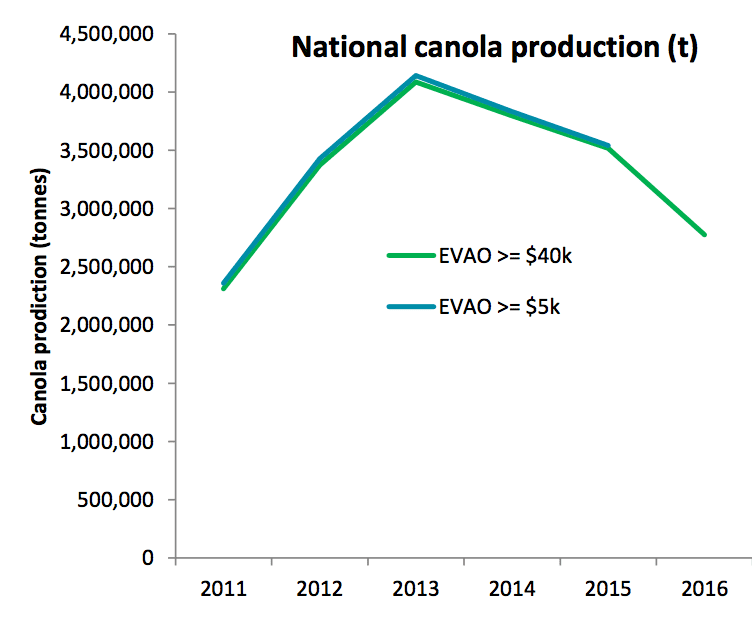
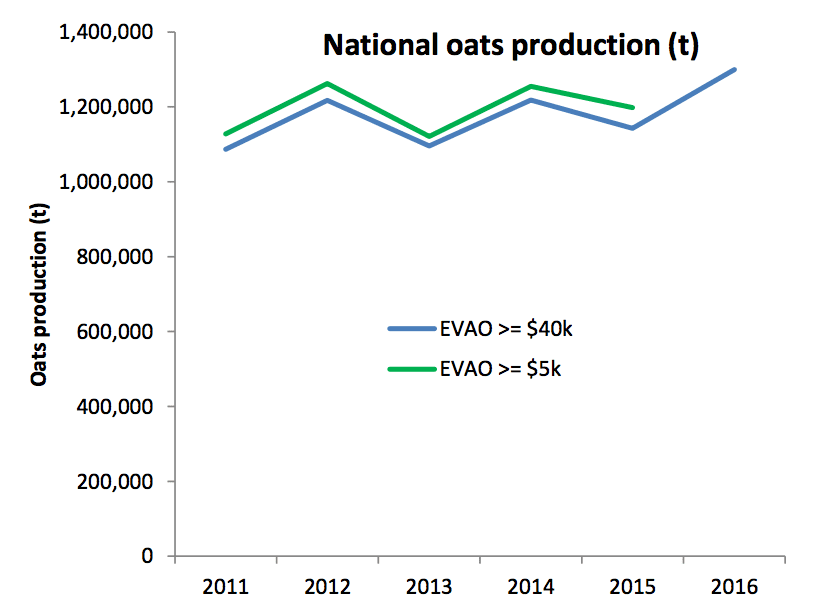
EVAO equals Estimated Value of Agricultural Operations survey
Barley
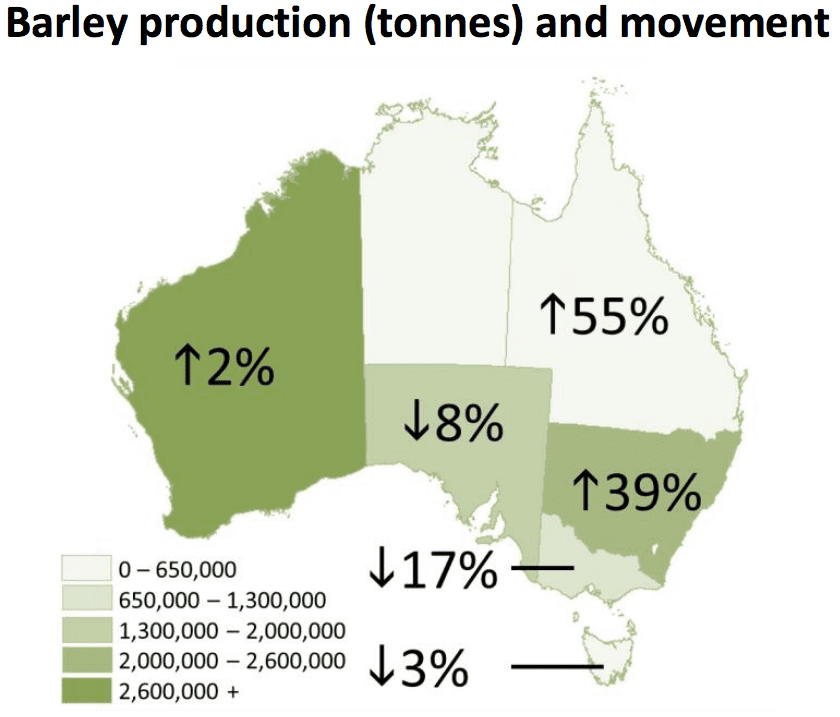
- National barley production increased from 8,465,679 tonnes in 2014-15 to 8,992,274 tonnes in 2015-16, an increase of 6pc
- Across Australia, the area planted to barley increased slightly to 4,107,648 hectares in 2015-16
- New South Wales experienced bumper yields due to good growing conditions resulting in an almost 40pc increase in production in 2015-16 to 2,527,655 tonnes
- Western Australia is Australia’s largest barley producer accounting for 36pc of the national barley crop in 2015-161
- Victoria experienced the lowest yield nationally, at 1.3 tonnes per hectare, predominantly driven by dry conditions, consistent with yields for winter crops in the State.
- The dry conditions seen in Victoria also extended through to South Australia and impacted the crop there with slightly lower yields and farmers planting a smaller crop than previous years (down 5pc).
- At a national level the gross value (GV) of barley decreased from $2.4b in 2014-15 to $2.3b in 2015-16, a fall of 4pc
- South Australia (-25pc), Victoria (-20pc) and Western Australia (-7pc) all reported falls in GV which were largely offset by an increase in GV in New South Wales (25pc).
Canola
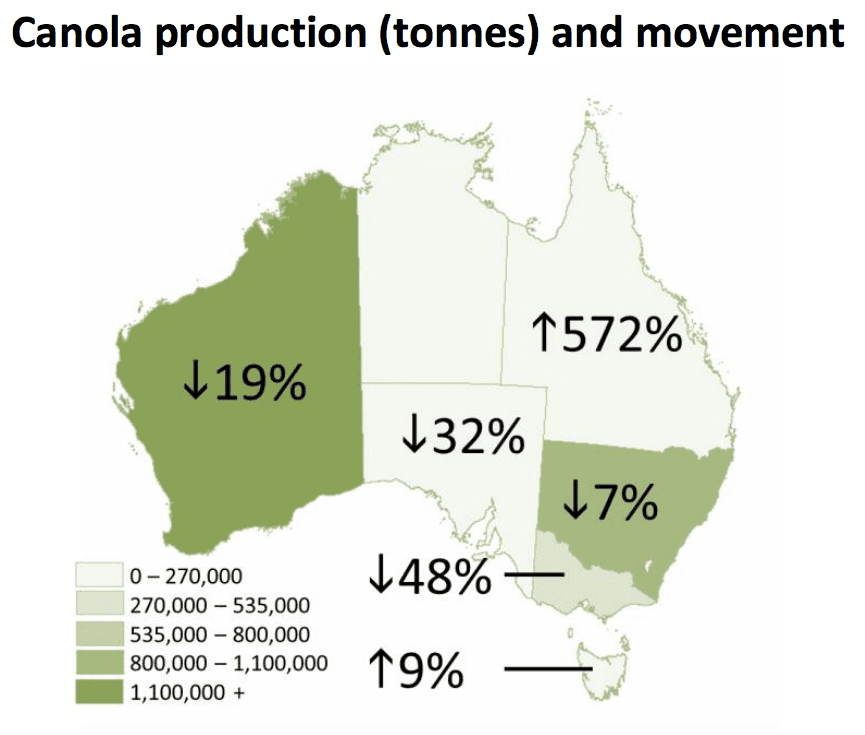
- National canola production decreased from 3,517,330 tonnes in 2014-15 to 2,775,479 tonnes in 2015-16, a decrease of 21pc.
- The national decrease was driven by a 27pc decrease, to 2,090,892 hectares, in area planted to canola for harvest in 2015-16.
- Western Australia, Australia’s largest producer of canola experienced a decline in production from 1,636,018 tonnes in 2014-15 to 1,327,849 tonnes in 2015-16, a decrease of 19pc.
- The national gross value (GV) of canola decreased from $1.8b in 2014-15 to $1.5b in 2015-16, a decline of 17pc.
- Gross value of canola fell 15pc in WA to $730.0m in 2015-16
- Victoria experienced a 44pc fall in the GV for canola due to a 48pc decrease in production
Cotton
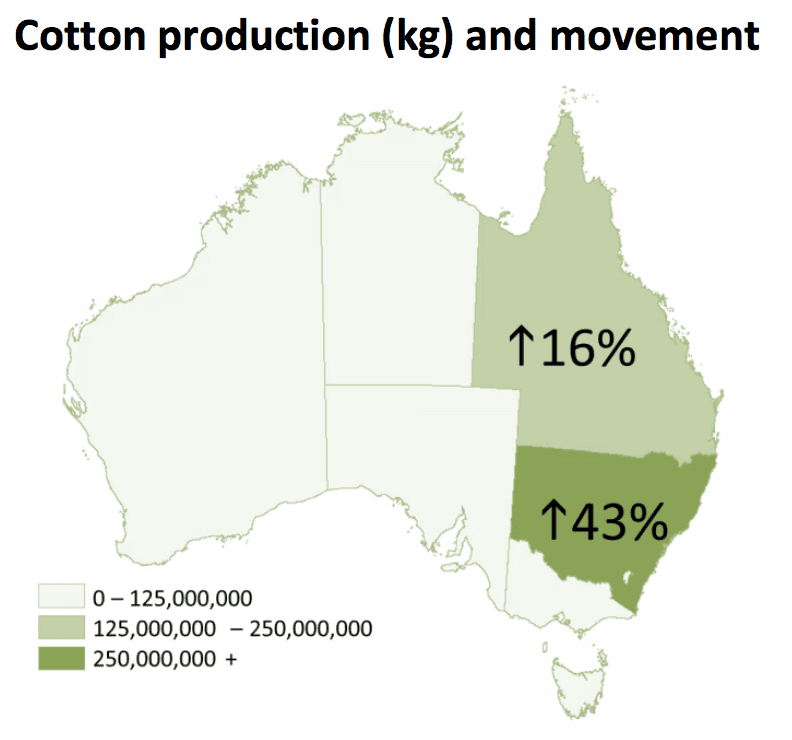
- Favourable growing conditions and water access have resulted in an increase in cotton production from 2014-15.
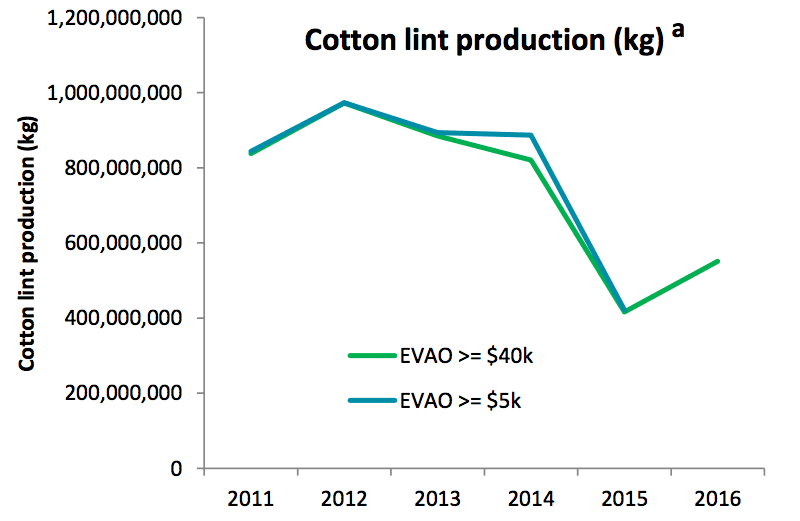
- Nationally, cotton production increased 32pc to 551 million kilograms, and the area planted to cotton increased by 43pc to 280 thousand hectares.
- National cotton lint production increased from 415,909,478 kilograms in 2014-15 to 550,894,596 kilograms in 2015-16, an increase of 32pc.
- In NSW cotton lint production increased from 253,823,434 kilograms in 2014-15 to 362,785,235 kilograms in 2015-16, an increase of 43pc.
- The total area planted to cotton increased from 195,993 hectares in 2014-15 to 280,422 hectares in 2015-16, an increase of 43pc.
- The yield on irrigated cotton land was 2,318 kg/ha in 2015-16, down from 2,451 kg/ha in 2014-15.
- The gross value (GV) of cotton increased by 42pc from $945.5m in 2014-15 to $1.3b in 2015-16.
- Cotton contributed $874.1 m, or 7pc to NSW’s gross value of agricultural production.
- Of the total area grown to cotton in 2015-16 75pc was irrigated with 1,432,093ML water applied.
Sorghum
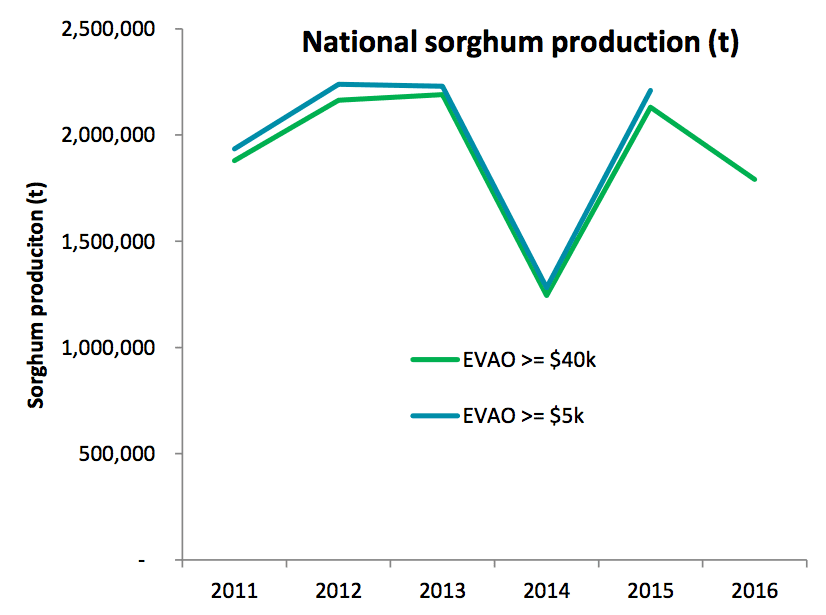
- National sorghum production decreased from 2,130,566 tonnes in 2014-15 to 1,790,574 tonnes in 2015-16, a decrease of 16pc.
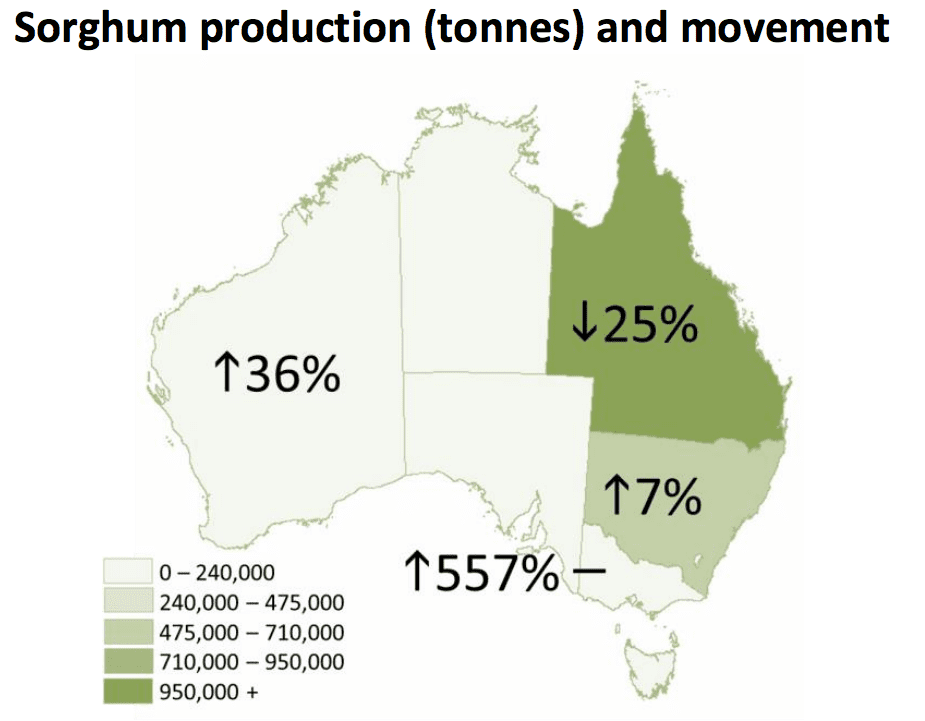
- Hot and dry growing conditions in central Queensland resulted in a 25pc fall in production from 1,561,860 tonnes to 1,177,451 tonnes
- Southern Queensland and New South Wales fared better, with good growing conditions and higher yields.
- New South Wales produced 604,000 tonnes of sorghum, 7pc up on last year despite a 12pc decrease in area planted.
- Production in New South Wales increased by 7pc as a result of good growing conditions in the north-east of the state
- The gross value (GV) of sorghum decreased by 23pc in 2015-16 from $642.1m to $491.6m, driven by declining production and lower gross unit values.
- The GV of sorghum in Queensland fell from $468.8m in 2014-15 to $312.1m in 2015-162
- Queensland is the largest producer of sorghum in Australia, accounting for 66pc of national production.
Oats
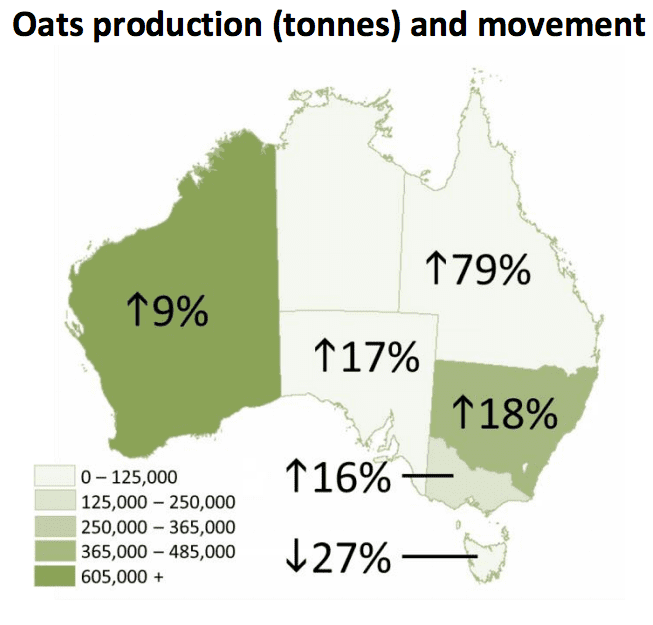
- Total oat production increased by 14pc to 1.3 million tonnes, with yields rising to 1.6 tonnes per hectare (an 11pc increase since 2014-15).
- Growing conditions in eastern states impacted the quality of crops for milling grade oats.
- The briefer growing period of oats attracted farmers who have been dealing with ongoing dry conditions and the continuing dry lead in to spring.
Key land use points:
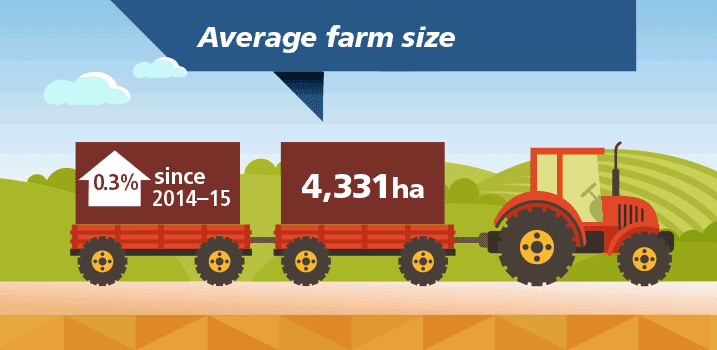
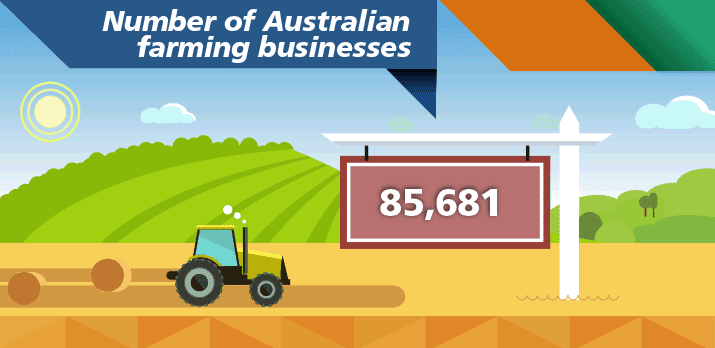
- At 30 June 2016 there were 371 million hectares of agricultural land in Australia, a 1pc increase compared with the previous year. Coinciding with this increase in agricultural land, there were 952 more agricultural businesses, representing a 1pc increase since 2014-15.
- Of all the states and territories, Queensland had the highest proportion of agricultural land, accounting for 34pc of total area of holding in Australia, a decline of 1pc since 2014-15.
Key farm management points:
In 2015-16, key attributes of Australian farm management were:
The average number of years respondents were involved in farming was 35. New South Wales, Queensland and Victoria had the highest average at 36 years and the Northern Territory the lowest at 24 years.
The majority of business income for agricultural producers in 2015-16 was from agricultural production (84pc), up from 83pc in 2014-15.



HAVE YOUR SAY