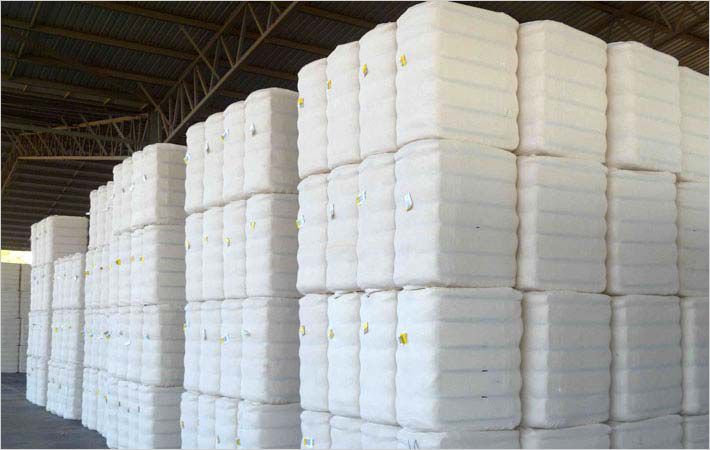
ROAD transport dominates the supply chain of cotton in Australia with more than two-thirds of the nation’s cotton production moved by road, according to new data released by the Bureau of Infrastructure, Transport and Regional Economics (BITRE).
 Rail transportation of cotton is not as prevalent, largely due to there being very few gins with direct access to rail sidings.
According to BITRE’s Freightline 5 – Australian cotton freight transport, total rail movements of cotton were approximately 99.6 million tonne kilometres in 2015–16 with total road freight movements estimated to have been 289.5 million tonne kilometres.
The crop is mostly grown in NSW (65 per cent) and Queensland (Figure 1).
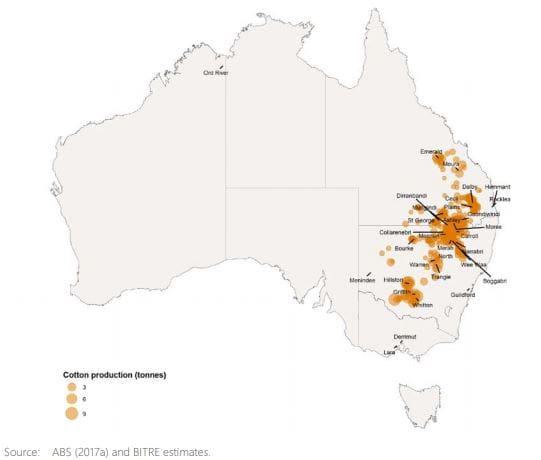
Figure 1: Cotton growing areas, Australia, 2015-16. (Source: ABS) (Click on map to enlarge)
Over the past two decades, Australia has, on average, produced approximately 550 kilotonnes (kt) of raw cotton lint per annum. Over 99 per cent of Australian total raw cotton production is exported.
Brisbane was the site of 48pc of all cotton exports, followed by Sydney and Melbourne at 28pc and 23pc respectively.
BITRE says 79.1pc of cotton taken to Brisbane was taken by road, as well as 60.6pc of the cotton taken to Melbourne and 52pc of that taken to Sydney – 366.9kt of the total 547.4kt exported in 2015-16.
The report says where and how cotton is moved depends on a number of factors, including prices, market volumes, transport costs and transport capacity.
Cotton transport arrangements are influenced by the location of ginning and storage facilities, and nearby transport links.
The transport of Australia’s cotton harvest is currently handled by a mix of road and rail transport modes (Figure 2).
The movement of cotton from farm to gins is almost entirely handled by road transport. Approximately 67pc of transportation of raw and processed cotton by weight is via road.
BITRE estimates the total cotton transport task was approximately 389 million tonne kilometres in 2015–16, with approximately 67pc of this transported via road.
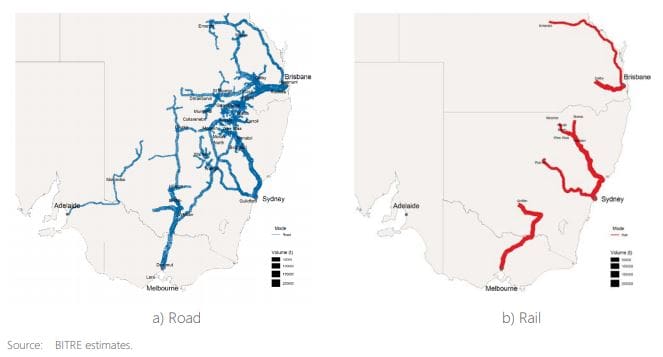
Figure 2: Cotton transport volumes, separated by mode, 2015–16. (Source: BITRE) (Click on map to enlarge)
Source: Bureau of Infrastructure, Transport and Regional Economics (BITRE) 2018, Freightline 5 – Australian cotton freight transport, BITRE, Canberra.
Grain Central: Get our free daily cropping news straight to your inbox – Click here


HAVE YOUR SAY