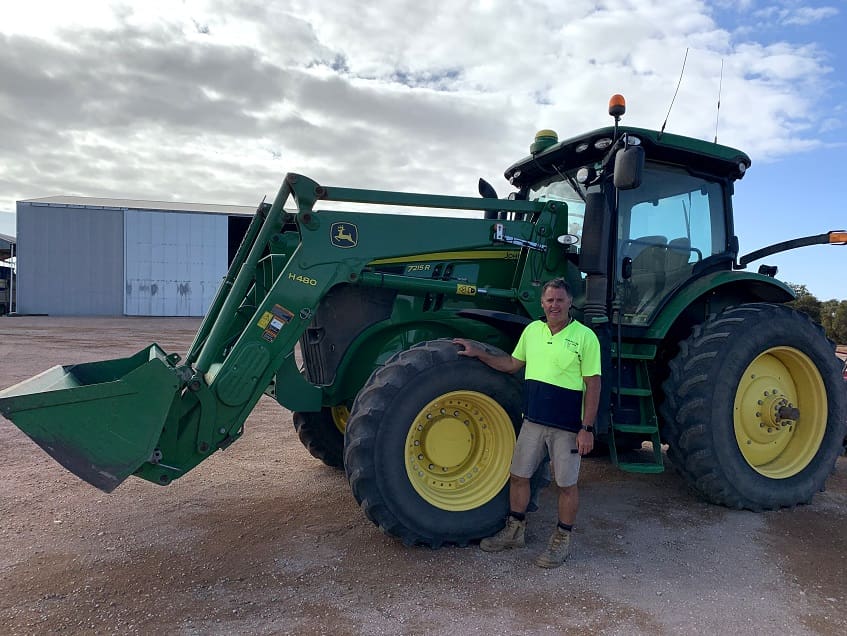
Stephen Paddick has used yield maps with satellite NDVI maps to identify and treat problem saline areas on his farm at Wallaroo in South Australia.
Case study
OVER a decade of yield mapping combined with satellite NDVI imagery and soil testing has helped South Australian farmer, Stephen Paddick, identify problem saline areas on his Wallaroo farm and treat them accordingly.
Farm profile
– Farming personnel: Stephen, Shane and Brian Paddick
– Farm location: Wallaroo, South Australia
– Annual rainfall: 375 millimetres
– Farm area: 2000 hectares
– Soil types: Grey calcareous loams
– Topography: Flat with little undulation
– Enterprises: Wheat, barley, lentils, canola, export oaten hay
– Average wheat yield: 3 tonnes per hectare
– SPAA member: Yes
– PA consultant: n/a
– Agronomy consultant: Patrick Redden, Rural Directions
………………………..
Top Precision Ag tips
– Use PA to help identify zones within paddocks and manage them uniquely.
– Satellite NDVI maps add more depth to yield maps.
– Use yield maps to identify high, medium and low-yielding areas and soil test those areas appropriately.
…………………………
Precision Ag timeline
– Yield mapping: 2000
– Guidance: 2001
– Autosteer: 2004
– Variable rate: 2007
– On-farm trials: 2007
– Inter-row sowing: 2012

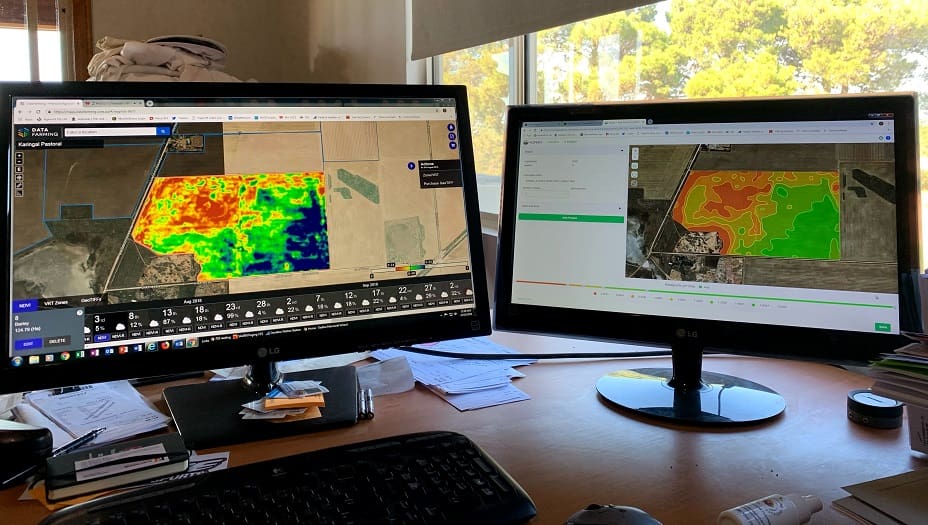
Stephen Paddick combines yield maps with satellite NDVI maps to help identify different zones within paddocks, particularly low-yielding saline zones.
Why did you choose to adopt precision farming technology?
We first started using yield maps in 2000 to help us identify different zones of the paddock so we could better prescribe seed and fertiliser rates. One of the initial reasons we started exploring precision ag technology was to lessen the overlap when we were seeding, spraying and spreading. We started by purchasing a Zynx unit from KEE Technologies, which was our first guidance system. We have now progressed to the John Deere StarFire system. Guidance and autosteer mean there is less fatigue on the operator when they are working longer hours during peak times such as seeding and harvest.
Which technology tools or components have you adopted and (which do you) continue to adopt?
Maps have become a very important part of our farming business. We now have about 13 years’ worth of yield maps on file which has enabled us to build up a significant amount of records and compare back year after year. We also use satellite NDVI maps now to add more depth to those comparisons and can use both the yield maps and satellite maps to help differentiate the zones in our paddocks. We use John Deere Operations Centre to help us manage that data and build prescription maps for seeding and spreading. We also use data from soil tests to help define different zones in our paddocks.
Looking ahead, we will be going down the path of controlled traffic farming. Our grey calcareous soils compact so we definitely see benefits in keeping machinery on the same tram lines to help limit the compaction.
What are the factors that motivate you to adopt and use each of the different tools or PA components?
The mapping we use has helped us to identify low-performing saline areas on our farm. Our farm is quite close to the coast so these areas are always going to be there, but mapping technology has helped us define those zones and manage them better.
Once we have our paddock zones defined, we know where the saline areas are so we can manage and spread straw to help retain moisture. In those saltier areas, the biomass is much lower so we remove biomass from high-yielding areas by baling straw and putting it on those low yielding areas to get cover and increase yield.
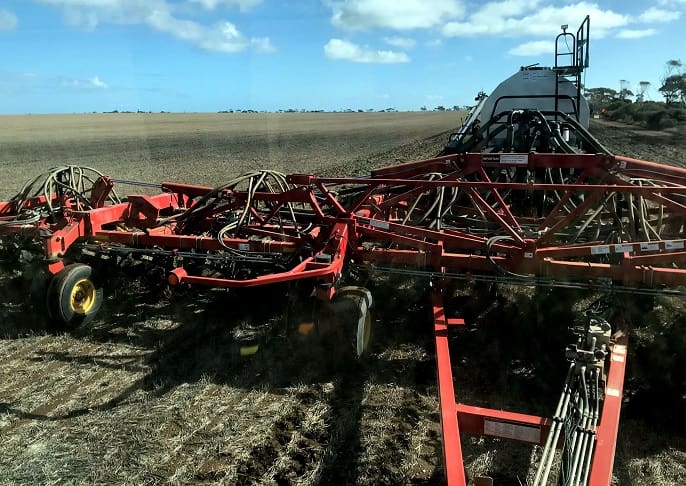
When we first started putting straw back on these low yielding areas, we could definitely see a yield increase. Those areas were yielding about 0.5t/ha and now they are up to 2t/ha quite easily. We’ve had a straw spreader here for 5-6 years now. We will cut the straw, bale it up with a large square baler and then in March we will spread it. The straw tends to break up quite quickly so the seeder doesn’t have any trouble getting through it.
What types of data and information are you collecting to guide your decision-making to adopt or not adopt each PA component?
It is mainly yield, NDVI and soil sampling data we are collecting at the moment. We are happy with the information these tools provide us. We have looked at pH mapping, which might be another option for us in the future.
Yield maps help us identify areas for soil sampling. We sample high, medium and low-yielding areas to see what nutrients have been used by the previous crop. Those low-yielding areas typically still have a lot of nutrients in the ground so we use that information to prescribe variable rate maps. Because we are using variable rate rather than blanket applications, we are putting more fertiliser where it is needed.
Has the adoption of PA increased profitability on your farm? How?
I think PA has definitely increased profitability on our farm. We have reduced those saline areas in the paddocks and lifted the yield in those areas. For example, we could have a 100ha paddock and previously, 20ha would be saline, but that area has now been reduced down to 3-5ha. That has happened just by knowing where those low-yielding saline areas are and creating a map to help us manage it with straw.
How are you using the data generated by PA? Is it leading to further practice change? If so, what kind of practice change?
The data generated by PA has definitely led to practice change on our farm. The straw spreading to treat saline areas is a good example of that.
It’s not only that but variable rate as well. We use variable rate for both our fertiliser and seed during seeding, but also for in-crop applications of nitrogen. On low-yielding areas, we try to increase our seeding rates to get plant numbers up, but we also decrease our fertiliser in those areas.
We load those same variable rate maps into the spreader tractor to help us better target areas with more or less nitrogen. We do this in conjunction with satellite NDVI maps which are now being offered on a weekly basis, so we apply those maps to our spreading operation as well.

Using variable rate maps created from yield and NDVI data means Stephen Paddick can increase seeding rates on low-yielding, saline areas to increase plant numbers but also decrease fertiliser rates.
Who is influencing or assisting you with the adoption of PA?
While I’m not as tech-savvy as my children, I do definitely enjoy the technology side of things. For that reason, I am constantly researching any new or emerging technology. The internet is a fantastic resource where I can go and explore any new technology which might apply to my farm. Social media, particularly Twitter, is another great influencer for me. It has enabled me to connect with farmers around the world who share their own ideas, which definitely perks my interest.
Are you planning to adopt more or less of these various precision farming technology components in the future?
In terms of new technology, we have probably levelled out on what we want to adopt but we will always look for new software which might be able to help us with our operations.
I find real-time technology particularly exciting. For example, as the tractor is pulling the seeder you will be able to see in real-time what is happening as the crop is being planted and make any adjustments on the go.
Robotics is another exciting area. Technology such as SwarmFarm might be commonplace one day. The cost might be prohibitive now, but it’s important to remember that it used to cost $50,000 to have guidance on a tractor, whereas nowadays it’s a standard feature. I expect the same thing will happen with robotics.
Contact details: Stephen Paddick, 0438 859 630, [email protected]
……………………………
Source: Society of Precision Agriculture Australia
This case study was supported by SPAA through funding from the South Australian Grain Industry Trust Fund as part of project SPAA118 – Conversations with Farmers: Agricultural Practice Change with the “PA-Early Adopters”
Produced by AgCommunicators P/L and Lightning Designs
More case studies available from SPAA website: www.spaa.com.au
Grain Central: Get our free daily cropping news straight to your inbox – Click here

HAVE YOUR SAY