REMOTE sensor technologies like cameras, GPS trackers, and weather stations have revolutionised biological data collection in the field.
Now researchers can capture continuous datasets in difficult terrain, at a scale unimaginable before these technologies became available.
But as this flood of data has rolled into laboratory computers around the world, researchers have found themselves without well-developed analytical tools to make sense of it all.
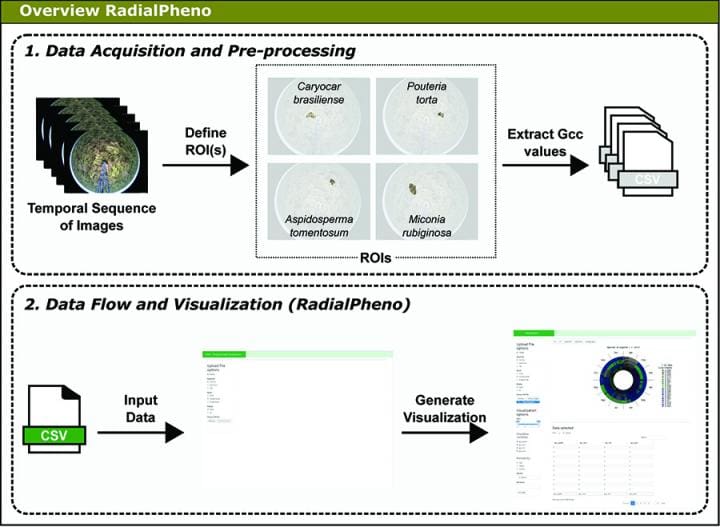
Example of RadialPheno workflow starting with a set of images from a fisheye phenocam and four regions of interest (ROIs); each ROI represents one individual species’ crown. From the image processing, indices including the daily green chromatic coordinate (Gcc) values representing the leaf flushing phenophases for each species are obtained and saved as a CSV file, which is used as a data input in RadialPheno. (Image credit: Mariano, G. C., B. Alberton, L. P. C. Morellato, and R. da S. Torres. 2019. RadialPheno: A tool for near-surface phenology analysis through radial layouts. Applications in Plant Sciences 7(6): e1253. https://doi.org/10.1002/aps3.1253)
In research presented in a recent issue of Applications in Plant Sciences, Dr Greice Mariano and colleagues introduce a tool called RadialPheno to analyse leafing patterns of plants based on remote camera data.
Before the widespread use of remote sensing equipment for field data collection, manual observation by scientists was a laborious, monotonous, and error-prone task, yielding much smaller and more dubious datasets.
This is perhaps particularly true of phenology—the study of the timing of developmental events like leafing, flowering, and fruiting—because solid phenological observation requires being in the right place at the right time.
“On-the-ground phenological observations are accomplished periodically, require much more labour, and rely on the people that perform the observations,” said Dr Mariano, corresponding author on the article and currently a post-doctoral research fellow at OCAD University, Toronto, Canada.
“On top of that, results are stored in spreadsheets, which does not allow interoperability between data, making it difficult to analyse the data.”
The ability to obtain rich sets of observations by setting up relatively inexpensive remote cameras has changed all that. But these observations don’t mean much unless they can be translated into integrated, tractable datasets that can yield meaningful insights.
“Since remote monitoring is something new to phenology studies, there is a need to develop and improve methods for detecting changes in phenological series and data images, setting up standards,” said Dr Mariano, who conducted this research during her PhD at the Institute of Computing, University of Campinas, Brazil.
“Thus, in this research we introduced RadialPheno as a tool to support phenology experts in their analyses.”
To identify the needs of these phenology experts, Dr Mariano and her team worked with researchers at the Phenology Laboratory at São Paulo State University (UNESP).
Dr Mariano investigated what they wanted to see from data visualization tools and the issues they experience with existing software.
Based on this investigation, Dr Mariano said they “developed a tool focused on the visualization of temporal data, where the identification of recurrent events is the most important task. We also thought about the integration of the visualization with the common statistical methods used by the experts.
“We choose radial representation because those structures are useful for understanding cyclical events, such as phenological ones.”
The team tested their new tool by measuring leafing patterns in the Brazilian cerrado, a vast savanna ecosystem dominated by a wet and dry season.
“Many plant phenology studies in Brazil have been conducted on a cerrado savanna area, and a digital camera for near-surface monitoring was installed in that area,” Dr Mariano said.
“Thus, we also have phenological data based on on-the-ground observations, which allowed us to validate our tool with both on-the-ground data and [camera-derived] data.”
The camera network they set up is part of a set of cameras installed in different areas called the Phenocam Network, which is available online.
Solid data about phenological patterns are more urgently needed than ever, as climate change alters the timing of events in ecosystems around the world with possibly dire consequences for ecological interactions. Fortunately, remote sensing technologies have made collecting these datasets possible; tools like RadialPheno can now make them more meaningful.
Source: Botanical Society of America
The original article: Mariano, G. C., B. Alberton, L. P. C. Morellato, and R. da S. Torres. 2019. RadialPheno: A tool for near-surface phenology analysis through radial layouts. Applications in Plant Sciences 7(6): e1253. https://doi.org/10.1002/aps3.1253
https://www.eurekalert.org/pub_releases/2019-08/bsoa-mso080919.php
Grain Central: Get our free cropping news straight to your inbox. Simply fill in and submit the ‘sign up’ box at the bottom right-hand corner of this page.
HAVE YOUR SAY