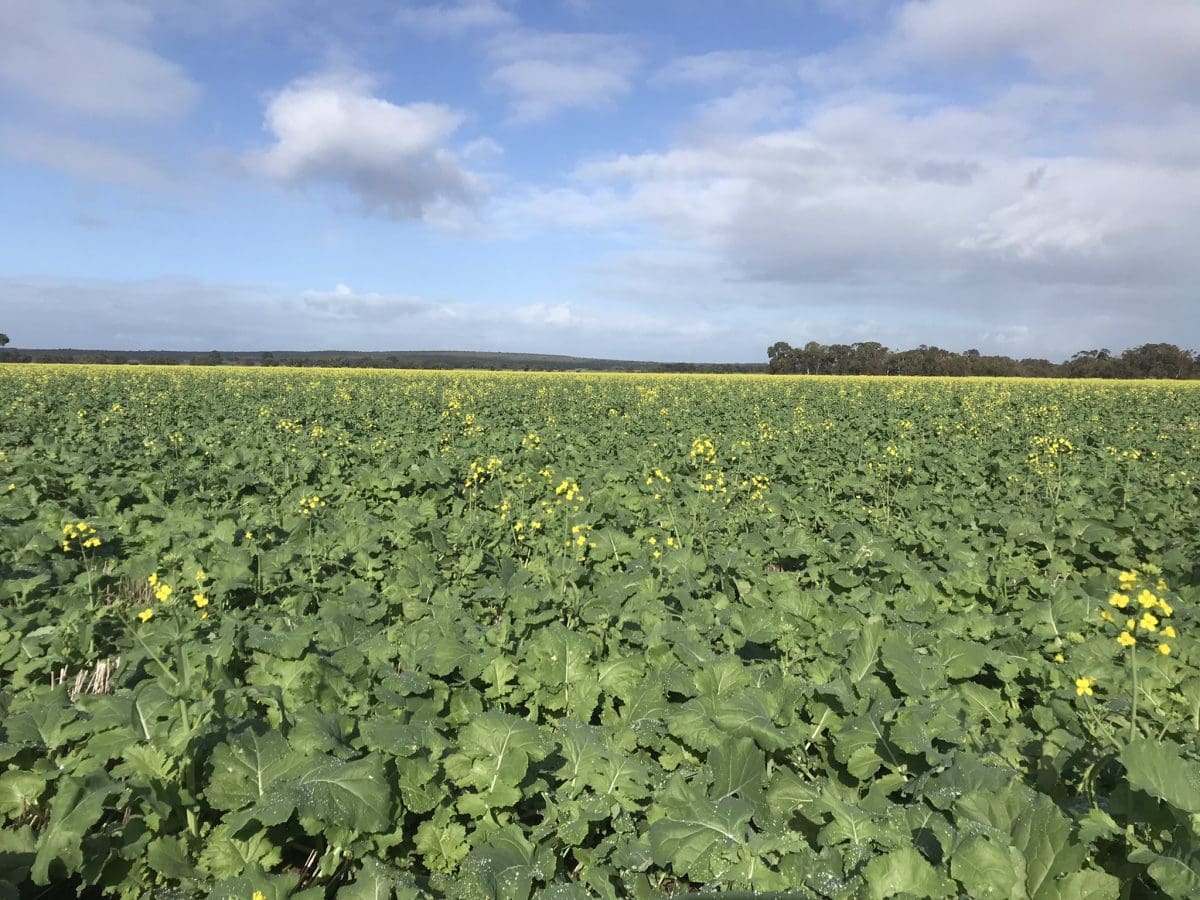
This crop of canola growing north-east of Dongara is one of many in WA to get off to an early and ideal start, and be looking at above-average yield potential. Photo: Levis MacKenzie, Viridisi Ag
AUSTRALIA is forecast to produce 27.8 million tonnes (Mt) of wheat, 10.4Mt of barley and 4.2Mt of canola from the crop just planted, according to the Australian Bureau of Agricultural and Resource Economics and Sciences’ (ABARES) Australian crop report – June 2020 released today.
The wheat number from the national forecaster represents a 17-per-cent drop from the record 33.3Mt crop grown last year, while the expected barley tonnage is down 21pc from last year.
In contrast, canola production is expected to rise 4pc.
Area planted to wheat is forecast to increase by 1pc to around 13.1 million hectares (Mha), while barley area at 4.2Mha is seen as down 4pc on last year.
Canola area is forecast to increase 25pc to almost 3Mha, Australia’s third-highest canola planting on record.
While dry conditions in South Australia have reduced its canola area from last year, increases have been seen in all other states.
“Area planted to canola is expected to be boosted by favourable world prices and excellent planting conditions in Western Australia and New South Wales,” ABARES executive director Dr Jared Greenville said.
WA and NSW are Australia’s two biggest canola-producing states, and WA canola area is seen as up 35pc from last year, while NSW canola area is forecast to have risen 27pc.
Tables below refer to crops planted in the year to 31 March.
| WHEAT PRODUCTION |
5yr avg to 2020-21 | 2019-20 | 2020-21 | 2021-22 estimate |
| Qld | 842,000 | 418,000 | 1,103,000 | 1,450,000 |
| NSW | 6,251,000 | 1,772,000 | 13,110,000 | 8,880,000 |
| Vic | 3,821,000 | 3,714,000 | 4,768,000 | 3,329,000 |
| Tas | 47,000 | 44,000 | 56,000 | 60,000 |
| SA | 4,140,000 | 2,689,000 | 4,800,000 | 4,100,000 |
| WA | 8,533,000 | 5,842,000 | 9,500,000 | 10,000,000 |
| TOTAL TONNES | 23,634,000 | 14,479,000 | 33,337,000 | 27,819,000 |
Table 1: Tonnes of wheat produced in all Australian states. Source: ABARES
| WHEAT AREA |
5yr avg to 2020-21 | 2019-20 | 2020-21 | 2021-22 estimate |
| Qld | 575,000 | 441,000 | 750,000 | 870,000 |
| NSW | 2,871,000 | 2,132,000 | 3,800,000 | 3,700,000 |
| Vic | 1,467,000 | 1,429,000 | 1,600,000 | 1,500,000 |
| Tas | 8,000 | 7,000 | 10,000 | 12,000 |
| SA | 1,954,000 | 1,721,000 | 2,075,000 | 2,075,000 |
| WA | 4,397,000 | 4,133,000 | 4,750,000 | 4,900,000 |
| TOTAL HECTARES | 11,272,000 | 9,863,000 | 12,985,000 | 13,057,000 |
Table 2: Hectares of wheat planted in all Australian states. Source: ABARES
| BARLEY PRODUCTION |
5yr avg to 2020-21 | 2019-20 | 2020-21 | 2021-22 estimate |
| Qld | 215,000 | 80,000 | 240,000 | 240,000 |
| NSW | 1,838,000 | 916,000 | 3,230,000 | 2,115,000 |
| Vic | 2,486 ,000 | 3,117,000 | 2,784,000 | 1,992,000 |
| Tas | 28,000 | 23,000 | 39,000 | 19,000 |
| SA | 2,175 ,000 | 1,995,000 | 2,400,000 | 1,900,000 |
| WA | 4,218 ,000 | 3,996,000 | 4,400,000 | 4,100,000 |
| TOTAL TONNES | 10,960 ,000 | 10,127,000 | 13,093,000 | 10,366,000 |
Table 3: Tonnes of barley produced in all Australian states: Source: ABARES
| BARLEY AREA |
5yr avg to 2020-21 | 2019-20 | 2020-21 | 2021-22 estimate |
| Qld | 114,000 | 80,000 | 135,000 | 120,000 |
| NSW | 865,000 | 885,000 | 950,000 | 900,000 |
| Vic | 931,000 | 1,102,000 | 870,000 | 830,000 |
| Tas | 6,000 | 5,000 | 7,000 | 5,000 |
| SA | 930,000 | 1,061,000 | 860,000 | 860,000 |
| WA | 1,726,000 | 1,907,000 | 1,600,000 | 1,530,000 |
| TOTAL HECTARES | 4,572,000 | 5,040,000 | 4,422,000 | 4,245,000 |
Table 4: Hectares of barley planted in all Australian states. Source: ABARES
| CANOLA PRODUCTION |
5yr avg to 2020-21 | 2019-20 | 2020-21 | 2021-22 estimate |
| Qld | 1,000 | 1,000 | 1,000 | 2,000 |
| NSW | 737,000 | 206,000 | 1,073,000 | 1,050,000 |
| Vic | 752,000 | 731,000 | 950,000 | 734,000 |
| Tas | 3,000 | 2,000 | 3,000 | 5,000 |
| SA | 315,000 | 241,000 | 375,000 | 320,000 |
| WA | 1,577,000 | 1,117,000 | 1,650,000 | 2,100,000 |
| TOTAL TONNES | 3,385,000 | 2,298,000 | 4,052,000 | 4,211,000 |
Table 5: Tonnes of canola produced in all Australian states: Source: ABARES
| CANOLA AREA |
5yr avg to 2020-21 | 2019-20 | 2020-21 | 2021-22 estimate |
| Qld | 1,000 | 1,000 | 2,000 | 2,000 |
| NSW | 586,000 | 327,000 | 550,000 | 700,000 |
| Vic | 428,000 | 405,000 | 450,000 | 500,000 |
| Tas | 1,000 | 1,000 | 1,000 | 2,000 |
| SA | 200,000 | 153,000 | 225,000 | 220,000 |
| WA | 1,262,000 | 1,148,000 | 1,150,000 | 1,550,000 |
| TOTAL HECTARES | 2,478,000 | 2,035,000 | 2,378,000 | 2,974,000 |
Table 6: Hectares of canola planted in all Australian states. Source: ABARES
Source: ABARES
Grain Central: Get our free daily cropping news straight to your inbox – Click here


HAVE YOUR SAY