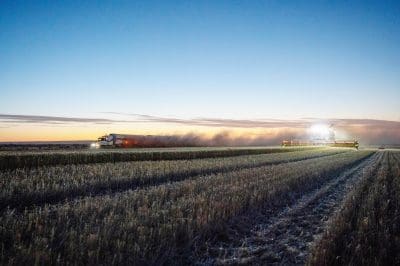
Harvest in the Geraldton zone of Western Australia. Photo: CLAAS Harvest Centre
AUSTRALIA’S area and tonnage forecasts for the wheat and barley crops now being harvested have all been revised down in the latest Australian Bureau of Agricultural Resource Economics and Sciences (ABARES) crop report released today.
The national wheat production forecast now sits at 15.9 million tonnes (Mt), down 17 per cent from 19.1Mt forecast in the previous ABARES Australian crop report released in September.
The drop has come about largely from a 25pc cut in Western Australia’s forecast tonnage, and a 29pc cut for NSW.
On barley, a 10pc increase in Victoria’s forecast barley production has not been enough to offset falls in all other mainland states.
The WA and NSW barley tonnage estimates have been revised down 13pc and 35pc respectively, and the national crop forecast now stands at 8.7Mt, down 8pc from 9.5Mt forecast in September.
| WHEAT | 5yr avg to 2018/19 | 2018/19 | Sep 2019/20 | Dec 2019/20 |
|---|---|---|---|---|
| Qld | 994,000 | 400,000 | 460,000 | 420,000 |
| NSW | 5,975,000 | 1,800,000 | 3,190,000 | 2,280,000 |
| Vic | 2,949,000 | 1,950,000 | 3,600,000 | 3,600,000 |
| Tas | 48,000 | 48,000 | 52,000 | 52,000 |
| SA | 4,283,000 | 2,950,000 | 3,750,000 | 3,500,000 |
| WA | 8,966,000 | 10,150,000 | 8,050,000 | 6,000,000 |
| TOTAL TONNES | 23,215,000 | 17,298,000 | 19,102,000 | 15,852,000 |
Table 1: Tonnes of wheat produced in all Australian states, with actual five-year average to 2018/19 and 2018/19 figures, and previous and revised estimates for 2019/20. Source: ABARES
| WHEAT | 5yr avg to 2018/19 | 2018/19 | Sep 2019/20 | Dec 2019/20 |
|---|---|---|---|---|
| Qld | 581,000 | 400,000 | 460,000 | 400,000 |
| NSW | 2,788,000 | 1,800,000 | 2,200,000 | 1,900,000 |
| Vic | 1,427,000 | 1,400,000 | 1,600,000 | 1,450,000 |
| Tas | 9,000 | 9,000 | 10,000 | 10,000 |
| SA | 1,964,000 | 1,850,000 | 2,050,000 | 1,950,000 |
| WA | 4,618,000 | 4,700,000 | 4,450,000 | 4,400,000 |
| TOTAL HECTARES | 11,387,000 | 10,159,000 | 10,770,000 | 10,110,000 |
Table 2: Hectares planted to wheat in all Australian states, with actual five-year average to 2018/19 and 2018/19 figures, and previous and revised estimates for 2019/20. Source: ABARES
| BARLEY | 5yr avg to 2018/19 | 2018/19 | Sep 2019/20 | Dec 2019/20 |
|---|---|---|---|---|
| Qld | 269,000 | 95,000 | 72,100 | 60,000 |
| NSW | 1,833,000 | 630,000 | 1,120,000 | 725,000 |
| Vic | 1,755,000 | 1,100,000 | 2,100,000 | 2,300,000 |
| Tas | 23,000 | 34,000 | 37,000 | 37,000 |
| SA | 2,012,000 | 1,535,000 | 1,900,000 | 1,850,000 |
| WA | 3,850,000 | 4,916,000 | 4,250,000 | 3,700,000 |
| TOTAL TONNES | 9,742,000 | 8,310,000 | 9,479,100 | 8,672,000 |
Table 3: Tonnes of barley produced in all Australian states, with actual five-year average to 2018/19 and 2018/19 figures, and previous and revised estimates for 2019/20. Source: ABARES
| BARLEY | 5yr avg to 2018/19 | 2018/19 | Sep 2019/20 | Dec 2019/20 |
|---|---|---|---|---|
| Qld | 117,000 | 70,000 | 55,000 | 45,000 |
| NSW | 854,000 | 600,000 | 700,000 | 580,000 |
| Vic | 864,000 | 770,000 | 850,000 | 800,000 |
| Tas | 6,000 | 9,000 | 10,000 | 10,000 |
| SA | 857,000 | 820,000 | 860,000 | 845,000 |
| WA | 1,473,000 | 1,450,000 | 1,650,000 | 1,650,000 |
| TOTAL HECTARES | 4,171,000 | 3,719,000 | 4,125,000 | 3,930,000 |
Table 4: Hectares planted to barley in all Australian states, with actual five-year average to 2018/19 and 2018/19 figures, and previous and revised estimates for 2019/20. Source: ABARES
Source: ABARES

HAVE YOUR SAY