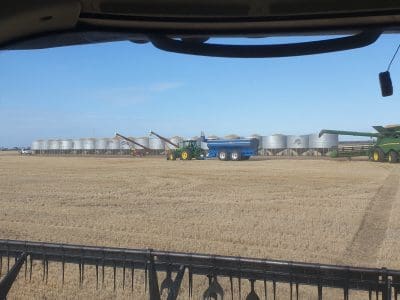
Harvesting barley near Esperance in November 2019. Photo: Greg Curnow
ABARES has cut the forecast for Australia’s wheat crop just harvested to 15.165 million tonnes (Mt) in its latest periodic crop report, down 4 per cent from 15.852Mt seen in the previous report released in December.
Area estimates for the national wheat crop are unchanged from the December report at 10.1M hectares.
The reduction in wheat tonnage comes from lower-than-expected yields in parts of New South Wales, South Australia and Western Australia, and the cutting of some crops for hay due to relatively low yield prospects and strong fodder prices.
ABARES’ estimate for the national barley crop just harvested has risen 2pc to 8.851Mt from 8.672Mt seen in the previous crop report.
A 20,000ha increase in the estimated Victorian barley area to 820,000ha is solely behind the national area estimate rising to 3.95Mha from 3.93Mha seen previously.
In barley production, a 9pc rise to 2.5Mt in the forecast for the Victorian crop, and a 22pc lift for Tasmania, have more than offset a cut to the NSW estimate to 696,000t, down 4pc from the December estimate.
| WHEAT | 5yr avg to 2018/19 | 2018/19 | Previous estimate for 2019/20 | Latest estimate for 2019/20 |
| Qld | 994,000 | 400,000 | 420,000 | 420,000 |
| NSW | 5,975,000 | 1,800,000 | 2,280,000 | 2,090,000 |
| Vic | 2,949,000 | 1,950,000 | 3,600,000 | 3,600,000 |
| Tas | 48,000 | 48,000 | 52,000 | 55,000 |
| SA | 4,283,000 | 2,950,000 | 3,500,000 | 3,200,000 |
| WA | 8,966,000 | 10,150,000 | 6,000,000 | 5,800,000 |
| TOTAL TONNES | 23,215,000 | 17,298,000 | 15,852,000 | 15,165,000 |
Table 1: Tonnes of wheat produced in all Australian states, with actual five-year average to 2018/19 and 2018/19 figures, and previous and revised estimates for 2019/20. Source: ABARES
| WHEAT | 5yr avg to 2018/19 | 2018/19 | Previous estimate for 2019/20 | Latest estimate for 2019/20 |
| Qld | 581,000 | 400,000 | 400,000 | 400,000 |
| NSW | 2,788,000 | 1,800,000 | 1,900,000 | 1,900,000 |
| Vic | 1,427,000 | 1,400,000 | 1,450,000 | 1,450,000 |
| Tas | 9,000 | 9,000 | 10,000 | 10,000 |
| SA | 1,964,000 | 1,850,000 | 1,950,000 | 1,950,000 |
| WA | 4,618,000 | 4,700,000 | 4,400,000 | 4,400,000 |
| TOTAL HECTARES | 11,387,000 | 10,159,000 | 10,110,000 | 10,110,000 |
Table 2: Hectares planted to wheat in all Australian states, with actual five-year average to 2018/19 and 2018/19 figures, and previous and revised estimates for 2019/20. Source: ABARES
| BARLEY | 5yr avg to 2018/19 | 2018/19 | Previous estimate for 2019/20 | Latest estimate for 2019/20 |
| Qld | 269,000 | 95,000 | 60,000 | 60,000 |
| NSW | 1,833,000 | 630,000 | 725,000 | 696,000 |
| Vic | 1,755,000 | 1,100,000 | 2,300,000 | 2,500,000 |
| Tas | 23,000 | 34,000 | 37,000 | 45,000 |
| SA | 2,012,000 | 1,535,000 | 1,850,000 | 1,850,000 |
| WA | 3,850,000 | 4,916,000 | 3,700,000 | 3,700,000 |
| TOTAL TONNES | 9,742,000 | 8,310,000 | 8,672,000 | 8,851,000 |
Table 3: Tonnes of barley produced in all Australian states, with actual five-year average to 2018/19 and 2018/19 figures, and previous and revised estimates for 2019/20. Source: ABARES
| BARLEY | 5yr avg to 2018/19 | 2018/19 | Previous estimate for 2019/20 | Latest estimate for 2019/20 |
| Qld | 117,000 | 70,000 | 45,000 | 45,000 |
| NSW | 854,000 | 600,000 | 580,000 | 580,000 |
| Vic | 864,000 | 770,000 | 800,000 | 820,000 |
| Tas | 6,000 | 9,000 | 10,000 | 10,000 |
| SA | 857,000 | 820,000 | 845,000 | 845,000 |
| WA | 1,473,000 | 1,450,000 | 1,650,000 | 1,650,000 |
| TOTAL HECTARES | 4,171,000 | 3,719,000 | 3,930,000 | 3,950,000 |
Table 4: Hectares planted to barley in all Australian states, with actual five-year average to 2018/19 and 2018/19 figures, and previous and revised estimates for 2019/20. Source: ABARES
Source: ABARES
Grain Central: Get our free daily cropping news straight to your inbox – Click here

HAVE YOUR SAY