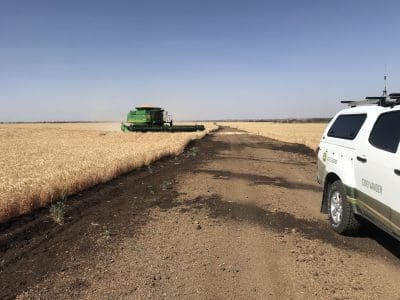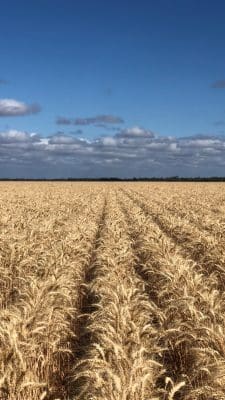
Harvesting a wheat crop at Gindie in Central Queensland. Photo: Richard Weston, Vanderfield
CENTRAL Queensland (CQ) farmers are around one-third through wheat harvest and well advanced on barley harvest, with both crops delivering average or slightly better yields to a strong market buoyed by feed demand.
“People are harvesting pretty much right through the highlands, starting with quicker-maturing varieties and early sown crops,” Spackman Iker Ag Consulting director Graham Spackman, Emerald, said.
“They’re into wheat and barley, and if they’re not into them already, they soon will be.”
In the ABARES crop report released yesterday, the national forecaster has pegged Queensland wheat production at 460,000 tonnes from 460,000 hectares, and barley at 72,100t from 55,000ha.
Trade sources estimate roughly 350,000t of Queensland’s wheat and around half its barley are likely to come from CQ. Mr Spackman said the region is growing much more barley than in previous years.
“There’s more barley here this year than we’ve ever had because the prices have been good, and growers are using it to spread their risk.
“A lot of them have their entire farm planted to winter crop this year, and barley works well; you can sow it early, and harvest it early.”

Nigel Gregg’s crop of Borlaug 100 wheat at Dysart averaged more than 5 tonnes per hectare and is one of CQ’s highest yielding crops for 2019. Photo: Stephen Gibson
Yields in CQ have been variable, and crops in shallower soils, or those which have suffered some frost damage, have brought the average back for some growers.
Barley has been yielding 1.7-1.8t/ha at the bottom end, and up to 3t/ha or better at the top end.
“Some wheat has been better than 3t/ha, but on average wheat would be 2-3t/ha, and anything going 2.5-3t/ha is a bit above average.
“Some parts of paddocks are getting 4-5t/ha, and others that have had frost damage or are in shallower soils might be down to around 1.5t/ha.”
Mr Spackman said crops in the central highlands from Capella to Springsure were returning the best yields, and most wheat was making AH to feed grades.
Frost damage has caused screening issues in some loads, and Mr Spackman said a shortage of nitrogen had seen plants put on yield at the expense of protein.
“There are instances of Prime Hard, but most growers probably didn’t put enough nitrogen on.”
A small number of cereal crops with low grain-yield potential have been cut for hay or silage.
Feedlot demand
Emerald Grain Toowoomba-based merchant Scott Merson said CQ was pricing off a Western Downs delivered price of around $415-$420/t, including $45-$50/t road freight.
“The grower target price seems to be $370/t on-farm, and feedlots in the Maranoa and on the Western Downs can work with that,” Mr Merson said.
“What CQ is going to produce is two months’ worth of southern Queensland consumption before the southern and WA grain becomes available, and that inverse between old-crop and new-crop disappears.”
CQ’s wheat harvest is on track to finish by the end of September.
CQ holds export hopes
GrainCorp’s shipping stem indicates both Mackay and Gladstone, CQ’s only two ports, are scheduled to ship 150,000t of wheat each between November 2019 and July 2020.
If executed, this will greatly reduce the amount of CQ wheat available for the domestic market.
Drought means no bulk exports of medium to high-protein wheat out of Brisbane, Newcastle and Port Kembla are scheduled out to July.
Bulk exports out of South Australia, Victoria and Western Australia are expected to continue as normal, as these states have much better production prospects than southern Queensland and most of NSW.
Southern Queensland activity
Harvest is also under way in pockets of the Western Downs and Maranoa, where reasonable yields are helping to make up for a dismal season on the Darling Downs proper.
Cloudless days, dry conditions and some high temperatures, as well as strong winds in the past week, have prompted many crops to mature faster than normal.
South of CQ, all districts sowed less area than intended to winter crop due to a lack of subsoil moisture in most paddocks, and insufficient rain in the planting window to ensure germination.
At Roma in the Maranoa district, Landmark agronomist Craig Miller estimates around one quarter of the intended wheat area was planted, and around half of that has been sacrificed to cattle or cut for hay.
“The average yield around here might be one tonne to the hectare, and isolated ones might go better,” Mr Miller said.
“Cattle got put into a lot of crops that weren’t doing well. The ones that are left were filling grain, but the weather this week is going to have crops turning quicker than they normally would, and frost might have made a difference too.”
On the Western Downs, MCA agronomist Ed Offner said cattle had been put into “a fair few paddocks”, but most crops still standing would make it through to harvest.
“Early barley crops have already been harvested, and they’ve been going around 1t/ha, but the wheat harvest won’t start for another three or four weeks,” Mr Offner said.
“There’s more barley around Condamine than I ever remember seeing, and in another two weeks, they’ll be in to harvesting that.”
Mr Offner said any crops which would not return a profit as grain because of low yields had already been grazed off rather than cut for hay, as most lacked the biomass to be profitable as fodder.
Feedlots are snapping up any grain, silage and hay they can from the southern Queensland as well as the CQ harvest, and piggeries are also buying grain off the header.
Table 1: ABARES September 2019 crop report forecast and average wheat area and production estimates for mainland Australian states.
| WHEAT | 2019 hectares | 2019 tonnes | 5yr avg to 2018 ha | 5yr avg to 2018 tns |
|---|---|---|---|---|
| Qld | 460,000 | 460,000 | 581,000 | 994,000 |
| NSW | 2,200,000 | 3,190,000 | 2,788,000 | 5,975,000 |
| Vic | 1,600,000 | 3,600,000 | 1,427,000 | 2,949,000 |
| SA | 2,050,000 | 3,750,000 | 1,964,000 | 4,283,000 |
| WA | 4,450,000 | 8,050,000 | 4,618,000 | 8,966,000 |
| Total | 10,760,000 | 19,050,000 | 11,378,000 | 23,167,000 |
Table 2: ABARES September 2019 crop report forecast and average barley area and production estimates for mainland Australian states.
| BARLEY | 2019 hectares | 2019 tonnes | 5yr avg to 2018 ha | 5yr avg to 2018 tns |
|---|---|---|---|---|
| Qld | 55,000 | 72,100 | 117,000 | 269,000 |
| NSW | 700,000 | 1,120,000 | 854,000 | 1,833,000 |
| Vic | 850,000 | 2,100,000 | 864,000 | 1,755,000 |
| SA | 860,000 | 1,900,000 | 857,000 | 2,012,000 |
| WA | 1,650,000 | 4,250,000 | 1,473,000 | 3,850,000 |
| Total | 4,115,000 | 9,442,100 | 4,165,000 | 9,719,000 |

HAVE YOUR SAY