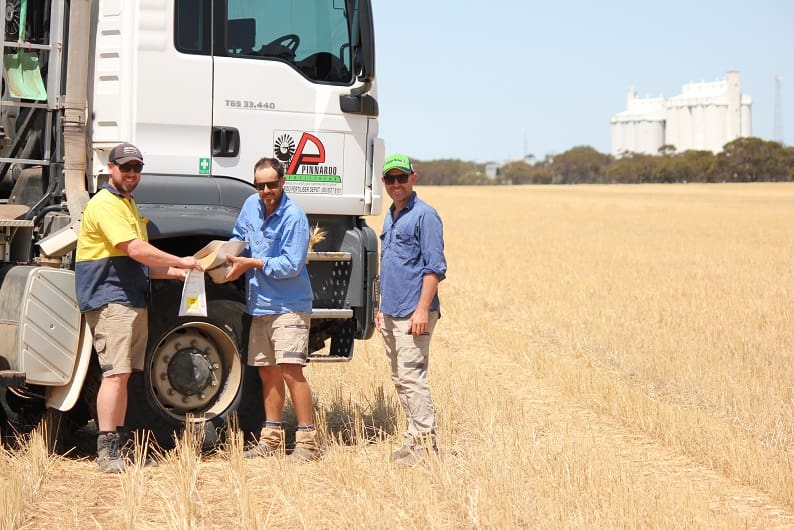
Pinnaroo Fertiliser’s Heath Boseley is running a grain testing program with local growers, including Giles Oster and David Lawson.
NEW data is being collected to help Mallee grain growers fine-tune their fertiliser recommendations based on the nutrients removed at harvest.
Pinnaroo Fertiliser’s Heath Boseley started a district-wide grain testing program at the end of 2018, encouraging all of his farmer customers to provide a grain sample for nutrient testing.
Grain nutrient testing quantifies the actual nutrient removal from the paddock, so growers aren’t relying on national averages or rules of thumb.
“It’s hard to see how published averages can be meaningful for growers. The data is pretty old, it’s not specific to the Mallee and it’s not based on the type of seasons we’re now experiencing. I thought it was time to ground truth these figures with some testing,” he said.
Mr Boseley sent all his customers sample bags to be returned to him with a small sample of grain.
Growers who provided a grain sample were given their individual grain test results and he also collated the results to provide customers with district-wide averages for a range of nutrients in different crops.
He said most Mallee growers worked on the assumption that a wheat crop removed 3 kilograms of phosphorus and 40kg of nitrogen per tonne of grain.
But based on the 50 grain test results he received back from the Nutrient Advantage laboratory after the 2018 season, Mr Boseley found the average phosphorus removal was actually 2.7kg of phosphorus per tonne of grain for that year.
“So far we only have one year’s data to go on, but over the next few years we’ll start to build a more complete picture of nutrient removal from crops in the Mallee,” he said.
While Mr Boseley plans to continue to collect nutrient removal data for the next three to five years, the early information has already proven valuable.
He said grain nutrient removal figures were used in nutrient budgeting, along with yield results, paddock histories and soil test results to ensure enough fertiliser was applied for the coming crops and to avoid nutrient run down.
“When we got this information back at the start of last year, growers were making tough decisions about their fertiliser programs,” he said.
“The growing season rainfall had only been around 150 millimetres and there had been spring frosts as well.
“This season hasn’t been much better, with rainfall below average again and a series of hard frosts, but it’s amazing what’s been harvested.”
Grain testing helps decision-making
One grower who is using the new information is Pinnaroo farmer, Giles Oster, who grows wheat, barley, lentils, canola, oaten hay and vetch.
His fertiliser decisions are made using a replacement fertiliser strategy based on paddock histories for the past couple of years and backed up by results from annual soil testing.
“To be able to measure what is removed in the grain is worth a lot to us,” Mr Oster said.
“You can guess, or go on gut feel, but to have the numbers there, that really helps with making decisions.”
Mr Oster slightly reduced his phosphorus application rates in 2019, based on the data collected and the poorer yields achieved in 2018, but increased nitrogen rates.
“Soil testing in autumn showed a lot of our paddocks were very low in available nitrogen, even where legumes had been grown,” he said.
Although the crops got out of the ground quite well, he said the second half of the season let them down.
“This harvest, we’ve seen some good results, some bad and some downright ugly, but overall we’re very fortunate with what we’ve got despite frost and lack of rainfall,” he said.
Nearby, David Lawson, who is farming 1600 hectares, set aside grain from the 2019 harvest for nutrient testing.
“The more information we can get, the better and grain nutrient testing isn’t really that hard to do,” he said.
Last season’s crop was marred by a series of frosts, with temperatures as low as -7oC. This wiped out 200ha of wheat and reduced the rest of the wheat yields by half, while barley yields were less affected.
With yields ranging from less than a tonne to 3.5t/ha, Mr Lawson is considering pre-spreading some fertiliser on selected paddocks to replace the nutrients removed before using a blanket starter fertiliser rate at sowing.
“We use soil testing, grain testing and all the information available to us to make sure we’re giving crops the fertiliser they need,” he said.
“I think the main risk is with under-fertilising because you’ve got to capitalise on the good years.
“The only way we made the yields we did last year was to take the chance to fertilise when there were good rain events, on paddocks that we knew were going to respond.”
Source: Pinnaroo Fertilisers
Congrats on a very useful local exercise.
Very useful to confirm a local average but the range in nutrient removal is probably more valuable when it can be related back to soil and seasonal conditions. Try viewing data as CDF function and look at the change in curve shape to understand effect of soil and season especially if sampling the same areas.
Similar study (not published) done in SE Qld and Nth NSW as few years ago with 400 + sites , average P removal 2.4 kg/t with range from 1.7 to 4.5 kg/t. Was interesting that the was a loose relationship; highest removal was from soil with higher P fertility (with low/moderate PBI) and lower P removal from lower P soils. In other words the higherP fertility soils were declining faster than lower ones if nil P fert applied. Also at the average P removal rate lower fertility soils were likely in buildup, while higher fertility ones where likely in decline at the same level of yield and P addition if below the highest removal (yield * 4.5 kg P)
Cheers