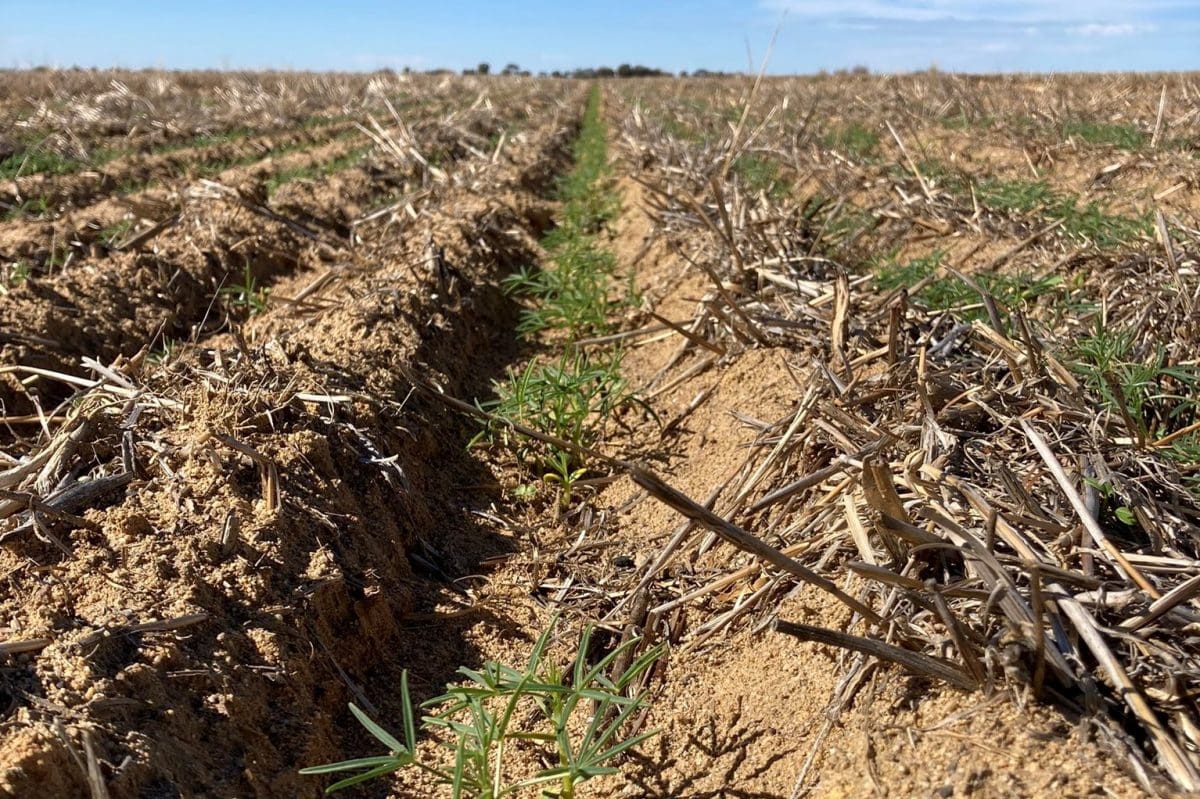
Barlock lupins planted early in the window in WA’s eastern wheatbelt. Photo: Jeremy Bryan
PRODUCTION in the current cropping year from Australia’s five major pulses is forecast at 2.28 million tonnes (Mt), 23 per cent below the 2.96Mt produced last year, according to Pulse Australia (PA).
The figure was released in the industry organisation’s first crop forecast for the current season for chickpeas, faba beans, field peas, lentils and lupins.
In area forecasts, PA estimates chickpeas and field peas are the only two of the five crops which have seen an increase in planted area from last year.
Chickpea area is forecast to rise by 11 per cent to 565,000 hectares, while field pea area is seen as being up 14pc to 238,000ha.
Faba bean area is expected to drop 9pc from last year to 245,000ha, and lentil area is forecast to shed 17pc to 304,000ha.
In Western Australia, a surge in canola plantings is largely behind a 23pc year-on-year drop in its lupin area to 385,000ha, while dry conditions in north-west Victoria and much of South Australia have reduced the national lentil area.
However, the national winter-cropping program has gotten off to a strong start generally, and pulse crops in WA and northern New South Wales have been planted into particularly good soil-moisture levels.
Rain last month in Queensland provided the necessary fillip to get chickpea and faba bean seeding under way after back-to-back seasons where dry conditions limited pulse area.
| State | Chickpeas | Field peas | Faba beans | Lentils | Lupins | TOTAL |
| Qld | 313,000 | 0 | 15,000 | 0 | 0 | 328,000 |
| NSW | 293,000 | 43,000 | 107,000 | 2,000 | 68,000 | 512,000 |
| VIC | 39,000 | 81,000 | 133,000 | 232,000 | 34,000 | 519,000 |
| SA | 14,000 | 114,000 | 144,000 | 184,000 | 59,000 | 516,000 |
| WA | 3,000 | 32,000 | 8,000 | 36,000 | 327,000 | 406,000 |
| National | 662,000 | 270,000 | 407,000 | 454,000 | 488,000 | 2,281,000 |
| Percentage of 2020 tonnage |
88pc | 92pc | 80pc | 72pc | 63pc | NA |
Table 1: Estimated tonnages for Australia’s major pulse crops grown in 2021.
Chickpeas
Good rainfall across most of the chickpea-growing regions in March began replenishing the soil-moisture bank, with up to 200 millimetres falling across widespread areas.
Although April and May experienced average or below-average rainfall, the presence of subsoil moisture provided the confidence to plant chickpeas in a profile that was one to two thirds full.
Confidence was further bolstered by growing market demand outside India, with Bangladesh and especially Pakistan already consuming two-thirds of 2020 production, and markets such as Nepal, the United Arab Emirates and the United Kingdom also growing.
Queensland chickpea area is seen as up 20 per cent on last year at this stage, but conditions are drying out in Central Queensland (CQ), which is in need of some good rain to support crops already in the ground.
However, the planting window is still open in CQ, and there could be some upside to its area if forecast sufficient rain eventuates.
On the back of near-record chickpea crops in New South Wales last year, growers have once again favoured chickpeas over cereals, with area seen as up 10pc. The high cereal-stubble level in NSW is also favouring non-cereal cropping options this season.
NSW growers will need to monitor closely for ascochyta this year in paddocks where heavy chickpea stubble from last season is present.
| State | 2020 interim final estimates | 2021 May estimates | ||
| Harvested hectares | Tonnes | Planted hectares |
Tonnes | |
| Central Qld Southern Qld |
97,000 133,000 |
110,000 165,000 |
115,000 160,000 |
132,000 181,000 |
| NSW | 220,000 | 396,000 | 238,000 | 293,000 |
| VIC | 45,000 | 68,000 | 37,000 | 39,000 |
| SA | 8,000 | 11,000 | 11,000 | 14,000 |
| WA | 5,000 | 5,000 | 4,000 | 3,000 |
| National total | 508,000 | 755,000 | 565,000 | 662,000 |
Table 2: Estimated 2020 and 2021 chickpea area and production estimates.
Faba beans
Faba bean production last season was exceptional as typical sown area yielded very atypical production, demonstrating the upside in yield capacity with faba beans when moisture is plentiful. Despite soft and falling prices last year, high yields meant generally strong grower returns on faba beans.
Fortunately, at a time of record production in Australia, Egypt re-entered the market, and was able to purchase much of the 2020 production, minimising the need for storage and possible downgrading of stored beans.
Area has reduced this year by around 10pc, mostly out of South Australia and Queensland, down 18pc and 73pc respectively on last year’s area. The emergence of an aphid-borne virus on faba beans last year has not deterred growers in northern NSW from maintaining a strong presence of faba beans in the rotation, so vigilance will be required by its growers to ensure appropriate management controls.
| State | 2020 interim final | May 2021 estimate | ||
| Harvested hectares |
Tonnes | Planted hectares |
Tonnes | |
| Qld | 30,000 | 42,000 | 8,000 | 15,000 |
| NSW | 55,000 | 110,000 | 59,000 | 107,000 |
| VIC | 80,000 | 160,000 | 92,000 | 133,000 |
| SA | 95,000 | 185,000 | 78,000 | 144,000 |
| WA | 9,000 | 13,000 | 8,000 | 8,000 |
| National Total | 269,000 | 510,000 | 245,000 | 407,000 |
Table 3: Estimated 2020 and 2021 faba bean area and production estimates.
Field peas
Drier conditions in southern NSW and the Victorian Mallee and Wimmera have favoured field peas over other thirstier non-cereal crops like canola, and consequently the field pea area is sen as up in NSW and Victoria. Field peas are unlikely to achieve the yield experienced last year, so only average yields have been applied in this forecast.
Demand for peas domestically for feed will be modest, with sufficient fodder now available, while export demand is also subdued.
| State | 2020 interim final estimate | May 2021 Estimate | ||
| Harvested hectares |
Tonnes | Planted hectares |
Tonnes | |
| Qld | 0 | 0 | 0 | 0 |
| NSW | 34,000 | 61,000 | 40,000 | 43,000 |
| VIC | 55,000 | 83,000 | 74,000 | 81,000 |
| SA | 85,000 | 105,000 | 86,000 | 114,000 |
| WA | 35,000 | 45,000 | 38,000 | 32,000 |
| National Total | 209,000 | 294,000 | 238,000 | 270,000 |
Table 4: Estimated 2020 and 2021 field pea area and production estimates.
Lentils
Despite the very strong lentil price at the time of planting, drier conditions, particularly on South Australia’s Yorke Peninsula, and the switch to canola in areas of sufficient moisture have driven lentil area down to more typical levels. This is particularly so in SA, where the area sown in 2020 was a record. The excellent conditions last year also delivered record or close-to-record yields, with production only eclipsed by the record year of 2016.
Despite some rain in late May, conditions remain dry throughout most of the SA cropping region, with root-zone soil moisture mostly below 20pc of capacity. This has hampered establishment of crops that have germinated, and will likely impact final yield potential.
Australia’s Burea of Meteorology has forecast some reasonable rain in the second half of June for SA lentil-growing areas which, if it eventuates, will be much needed by lentil crops at that time.
The WA lentil industry continues to grow and develop, despite a canola-driven reduction in other pulses in that state this season.
| State | 2020 interim final | May 2021 estimate | ||
| Harvested hectares |
Tonnes | Planted hectares |
Tonnes | |
| Qld | 0 | 0 | 0 | 0 |
| NSW | 7,000 | 10,000 | 2,000 | 2,000 |
| VIC | 180,000 | 306,000 | 161,000 | 232,000 |
| SA | 170,000 | 300,000 | 123,000 | 184,000 |
| WA | 11,000 | 18,000 | 18,000 | 36,000 |
| National Total | 368,000 | 634,000 | 304,000 | 454,000 |
Table 5: Estimated 2020 and 2021 lentil area and production estimates.
Lupins
Lupin area is down significantly this year, driven almost entirely by WA, where an outstanding start to the season and very high canola prices have pushed canola’s share of the rotation to very high levels. Of the lupins that have been planted in WA, the very favourable season-opening conditions have led to good establishment.
Elsewhere, the high yields experienced across the country last year are unlikely to be realised again this year, so average yields have been used in this forecast.
| State | 2020 interim final | May 2021 estimate | ||
| Harvested hectares |
Tonnes | Planted hectares |
Tonnes | |
| Qld | 0 | 0 | 0 | 0 |
| NSW | 68,000 | 130,000 | 68,000 | 68,000 |
| VIC | 38,000 | 44,000 | 34,000 | 34,000 |
| SA | 45,000 | 46,000 | 48,000 | 59,000 |
| WA | 350,000 | 550,000 | 235,000 | 327,000 |
| National Total | 501,000 | 770,000 | 385,000 | 488,000 |
Table 6: Estimated 2020 and 2021 lupin area and production estimates.
Source: Pulse Australia
Grain Central: Get our free cropping news straight to your inbox – Click here
HAVE YOUR SAY