TWENTY five years, 5308 samples, 26, 517 tests, 12 million ryegrass seeds. That’s 26, 517 times Charles Sturt University (CSU) has sown, sprayed and counted annual ryegrass from around 12 million seeds submitted from more than 5000 samples sent in from across Australia since it started testing for herbicide resistance in 1991… and that’s just ryegrass.
Mind numbing stuff.
But more than 5000 ryegrass samples? Most tested to five or six herbicides? Think about the value of that information!
Dr John Broster and Professor Jim Pratley from CSU have analysed the data from ryegrass samples sent to the testing service over the 25-year period from 1991 to 2015.
It’s important to note that these are samples sent for testing for a reason, mainly because herbicide resistance is suspected, but increasingly to determine the susceptibility of new or alternative herbicides.
In a snapshot, resistance was highest for Group A ‘fops’ (81 per cent), Group A ‘dens’ (81pc) and Group B (56pc). Group B also wins the gong for the fastest increase in resistance over the 25 years.
While these results aren’t unexpected, there are some interesting relationships where multiple resistance occurs within herbicide groups. For example, 100pc of samples tested to Group A fops and dens had the same resistance status to both, while only 39pc had the same resistance status when tested to Group A fops and dims. But, in a classic case of ‘oils ain’t oils’, this ranged from 35pc to 80pc depending on which dim herbicide was tested!
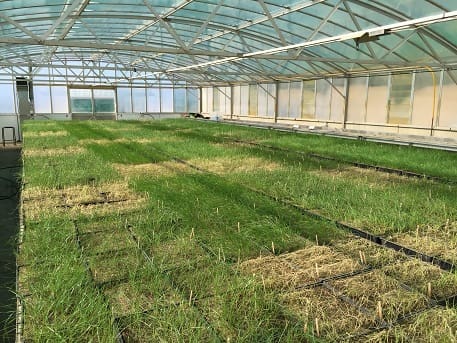
Figure 1 – herbicide resistance testing at CSU, Wagga Wagga NSW (J. Broster)
Changes in resistance over time
Since the testing service began more than 80pc of annual ryegrass samples tested to Group A fops and dens have been resistant. While fop resistance has increased over time, pinoxaden (eg. Axial) resistance hasn’t changed significantly since it was introduced in 2006.
Group B and Group M resistance has also increased over time, while Group C and Group D resistance has declined. Group A dim resistance has not changed significantly.
Less than 1pc of samples have tested resistant to Group L (paraquat/diquat) and no samples have tested resistant to propyzamide (Group D), prosulfocarb + metolachlor (eg Boxer Gold, Groups J & K) or pyroxasulfone (eg. Sakura, Group K) through the CSU testing service. Note that resistance to these pre-emergent herbicides has been detected by the University of Adelaide – see AHRI Insight #105 ‘Alphabet cross-resistance in South Australia’.
Table 1 – Resistance overview and changes over time
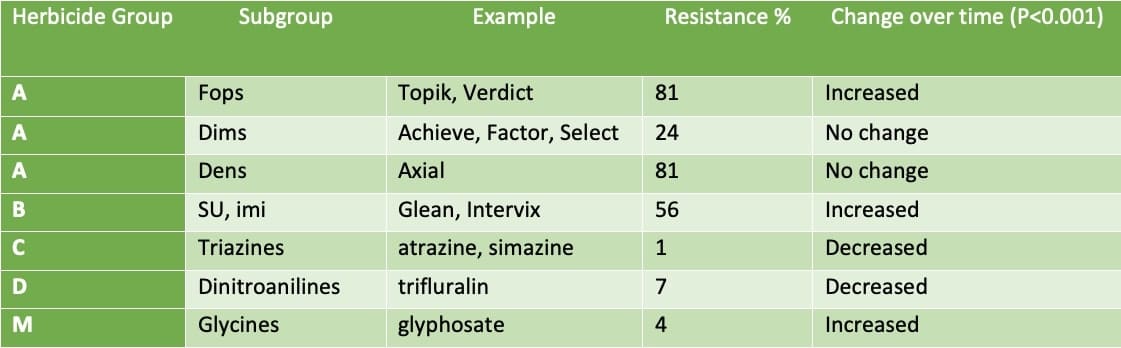
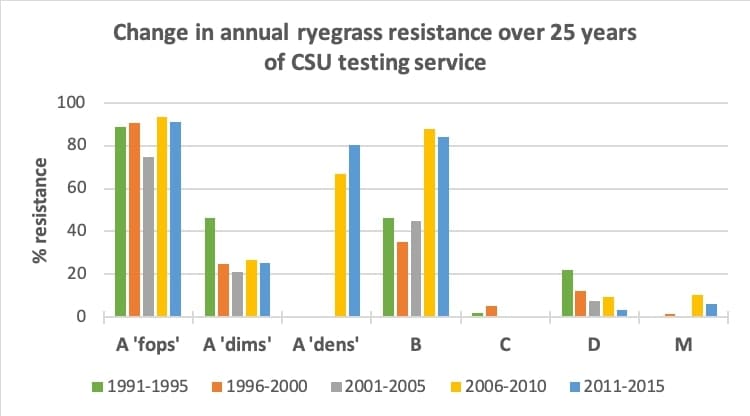
Figure 2 – Over 25 years, annual ryegrass resistance to Group A fops, B and M has increased. Group C and D resistance has declined, Group A dims and dens has remained stable (P<0.001).
Resistance to multiple herbicide groups
Over 3300 of the annual ryegrass samples were submitted for testing to the five standard herbicide groups (Group A fops and dims, B, C and D). Of these, only 9% were susceptible to all groups, while just 1pc were resistant to four groups.
Most samples were resistant to one or two herbicide groups, typically Group A fops or fops plus Group B. Those resistant to three groups were commonly through the addition of dim resistance.
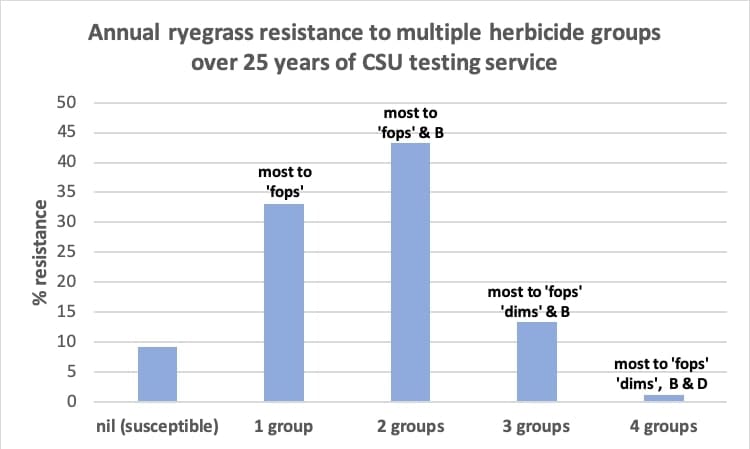
Figure 3 – Most annual ryegrass samples were resistant to one (Group A fops) or 2 (fops + Group B) herbicide groups.
Resistance patterns within herbicide groups
All Group A herbicides carry a high resistance risk, with a strong possibility of cross resistance to other Group A herbicides.
Group A fop + den
Analysis of the CSU data showed a strong correlation between annual ryegrass that was tested to both Group A fops and dens, with all samples having the same resistance status to both. That is, any sample that was resistant to fops was also resistant to dens, and conversely, any sample susceptible to fops was also susceptible to dens.
Group A fop + dim
The relationship between the resistance status of fop and dim herbicides was weaker, but there were differences between the type of dim herbicide. For example, fops showed a much stronger relationship to the resistance status of tralkoxydim (eg. Achieve) than clethodim (eg. Select).
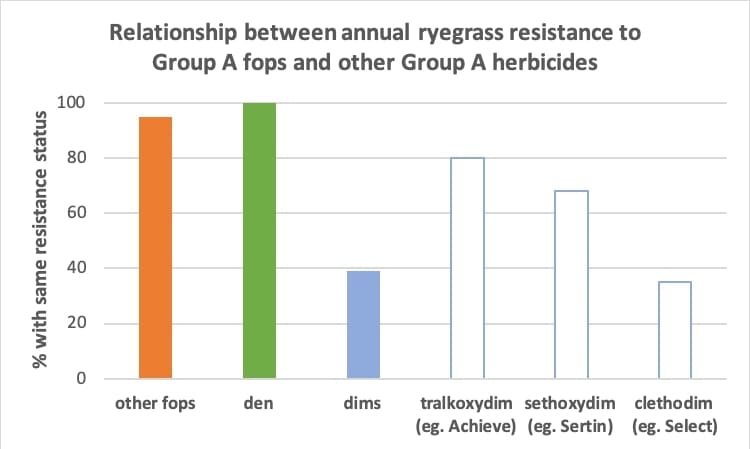
Figure 4 – There was a strong relationship between the resistance status of Group A fops and dens, but a weaker relationship to some dim herbicides.
Group A dims
While clethodim showed a weak relationship to the status of fop and den resistance, it varied in its correlation to other dim herbicides. Only 31% of samples tested to both clethodim and tralkoxydim (eg. Achieve) had the same resistance status, but 80% tested to both clethodim and butroxydim (eg. Factor) had the same resistance status. Food for thought when planning herbicide strategies for crop rotations and break crops.
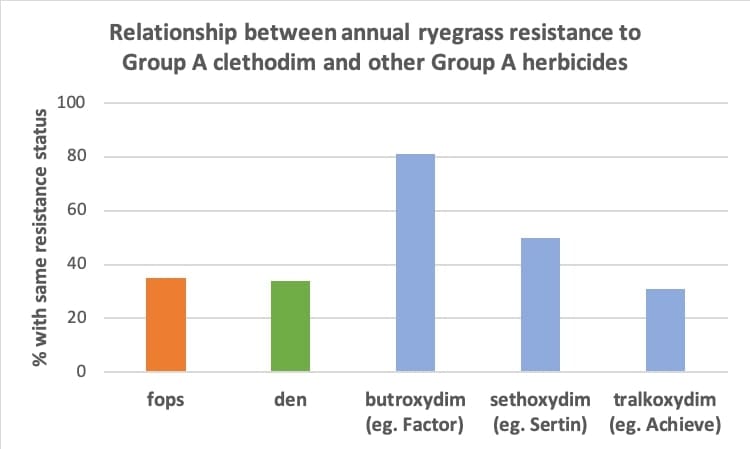
Figure 5 – The relationship between the status of clethodim resistance and other dim herbicides varied significantly, with the strongest correlation being to butroxydim (eg. Factor).
Group B
Group B herbicides have the notorious reputation of being the group most likely to develop resistance, even higher than Group A. The testing results have shown that 70pc of annual ryegrass samples tested to both sulfonylurea and imidazolinone herbicides had the same resistance status. Something to think about with the rapid increase in imi-tolerant crops in recent years.
We’re constantly being told herbicide resistance is a numbers game. Lower weed numbers mean lower selection pressure. Strive for zero. But in the case of the CSU resistance testing service, 5308 annual ryegrass samples with 26 517 resistance tests on 12 million seeds over 25 years is definitely a good thing!
Source: Australian Herbicide Resistance Initiative
HAVE YOUR SAY