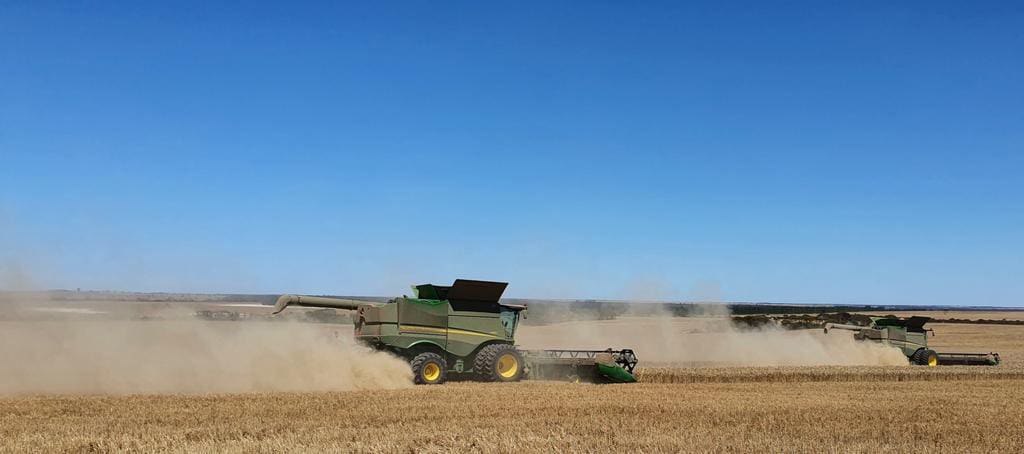
Yields in Western Australia have come in above earlier expectations to provide the major lift to ABARES forecasts in its February 2020 Australian crop report. Photo: Paul Carmody
AUSTRALIA’s national commodity forecaster has lifted its estimates for current-crop wheat, barley and canola in its latest Australian crop report to include the biggest wheat crop on record.
Harvesting of all three crops is now over in all but a few very late crops, with wheat now forecast to produce 33.3 million tonnes (Mt), 5 per cent higher than the previous record of 31.8Mt set in 2016-17, and up 7 per cent from the previous estimate issued in December.
On wheat, all area estimates are unchanged, and the lift in production has come largely from higher-than-expected yields in Western Australia and New South Wales.
The national forecast for barley production at 13.1Mt is up 9pc from 12Mt forecast in December, but is below the national record set in 2016-17 of 13.5Mt.
On barley, the South Australian area estimate has risen 20,000 hectares, but the bulk of the production rise has come from increased yields in NSW, SA and Victoria, with WA again the surprise packet.
Increases for Victorian and WA production alone have lifted the national forecast for canola by 9pc to 4.1Mt, again below the record set in 2016-17 of 4.3Mt.
| WHEAT | 5yr avg to 2019-20 | 2019-20 | 2020-21 Dec estimate | 2020-21 Feb estimate |
| Qld | 885,000 | 420,000 | 1,103,000 | 1,103,000 |
| NSW | 5,072,000 | 2,090,000 | 12,236,000 | 13,110,000 |
| Vic | 3,208,000 | 3,600,000 | 4,720,000 | 4,768,000 |
| Tas | 49,000 | 55,000 | 56,000 | 56,000 |
| SA | 4,018,000 | 3,200,000 | 4,900,000 | 4,800,000 |
| WA | 8,327,000 | 5,800,000 | 8,150,000 | 9,500,000 |
| TOTAL TONNES | 21,559,000 | 15,165,000 | 31,165,000 | 33,337,000 |
Table 1: Tonnes of wheat produced in all Australian states. Source: ABARES
| WHEAT | 5yr avg to 2019-20 | 2019-20 | 2020-21 Dec estimate | 2020-21 Feb estimate |
| Qld | 538,000 | 400,000 | 750,000 | 750,000 |
| NSW | 2,651,000 | 1,900,000 | 3,800,000 | 3,800,000 |
| Vic | 1,419,000 | 1,450,000 | 1,600,000 | 1,600,000 |
| Tas | 9,000 | 10,000 | 10,000 | 10,000 |
| SA | 1,939,000 | 1,950,000 | 2,075,000 | 2,075,000 |
| WA | 4,444,000 | 4,500,000 | 4,750,000 | 4,750,000 |
| TOTAL HECTARES | 11,000,000 | 10,210,000 | 12,985,000 | 12,985,000 |
Table 2: Hectares planted to wheat in all Australian states. Source: ABARES
| BARLEY | 5yr avg to 2019-20 | 2019-20 | 2020-21 Dec estimate | 2020-21 Feb estimate |
| Qld | 238,000 | 60,000 | 240,000 | 240,000 |
| NSW | 1,654,000 | 696,000 | 3,040,000 | 3,230,000 |
| Vic | 2,027,000 | 2,500,000 | 2,741,000 | 2,784,000 |
| Tas | 28,000 | 45,000 | 39,000 | 39,000 |
| SA | 2,009,000 | 1,850,000 | 2,300,000 | 2,400,000 |
| WA | 3,958,000 | 3,850,000 | 3,600,000 | 4,400,000 |
| TOTAL TONNES | 9,914,000 | 9,001,000 | 11,960,000 | 13,093,000 |
Table 3: Tonnes of barley produced in all Australian states. Source: ABARES
| BARLEY | 5yr avg to 2019-20 | 2019-20 | 2020-21 Dec estimate | 2020-21 Feb estimate |
| Qld | 107,000 | 45,000 | 135,000 | 135,000 |
| NSW | 807,000 | 580,000 | 950,000 | 950,000 |
| Vic | 869,000 | 820,000 | 870,000 | 870,000 |
| Tas | 7,000 | 10,000 | 7,000 | 7,000 |
| SA | 869,000 | 845,000 | 840,000 | 860,000 |
| WA | 1,651,000 | 1,750,000 | 1,600,000 | 1,600,000 |
| TOTAL HECTARES | 4,310,000 | 4,050,000 | 4,402,000 | 4,422,000 |
Table 4: Hectares planted to barley in all Australian states. Source: ABARES
| CANOLA | 5yr avg to 2019-20 | 2019-20 | 2020-21 Dec estimate | 2020-21 Feb estimate |
| Qld | 1,000 | 1,000 | 1,000 | 1,000 |
| NSW | 713,000 | 225,000 | 1,073,000 | 1,073,000 |
| Vic | 604,000 | 650,000 | 855,000 | 950,000 |
| Tas | 3,000 | 3,000 | 3,000 | 3,000 |
| SA | 296,000 | 300,000 | 375,000 | 375,000 |
| WA | 1,519,000 | 1,150,000 | 1,400,000 | 1,650,000 |
| TOTAL TONNES | 3,136,000 | 2,329,000 | 3,707,000 | 4,052,000 |
Table 5: Tonnes of canola produced in all Australian states. Source: ABARES
| CANOLA | 5yr avg to 2019-20 | 2019-20 | 2020-21 Dec estimate | 2020-21 Feb estimate |
| Qld | 1,000 | 2,000 | 2,000 | 2,000 |
| NSW | 574,000 | 250,000 | 550,000 | 550,000 |
| Vic | 389,000 | 385,000 | 450,000 | 450,000 |
| Tas | 1,000 | 1,000 | 1,000 | 1,000 |
| SA | 199,000 | 220,000 | 225,000 | 225,000 |
| WA | 1,211,000 | 950,000 | 1,150,000 | 1,150,000 |
| TOTAL HECTARES | 2,375,000 | 1,808,000 | 2,378,000 | 2,378,000 |
Table 6: Hectares planted to canola in all Australian states. Source: ABARES
Grain Central: Get our free cropping news straight to your inbox – Click here


HAVE YOUR SAY