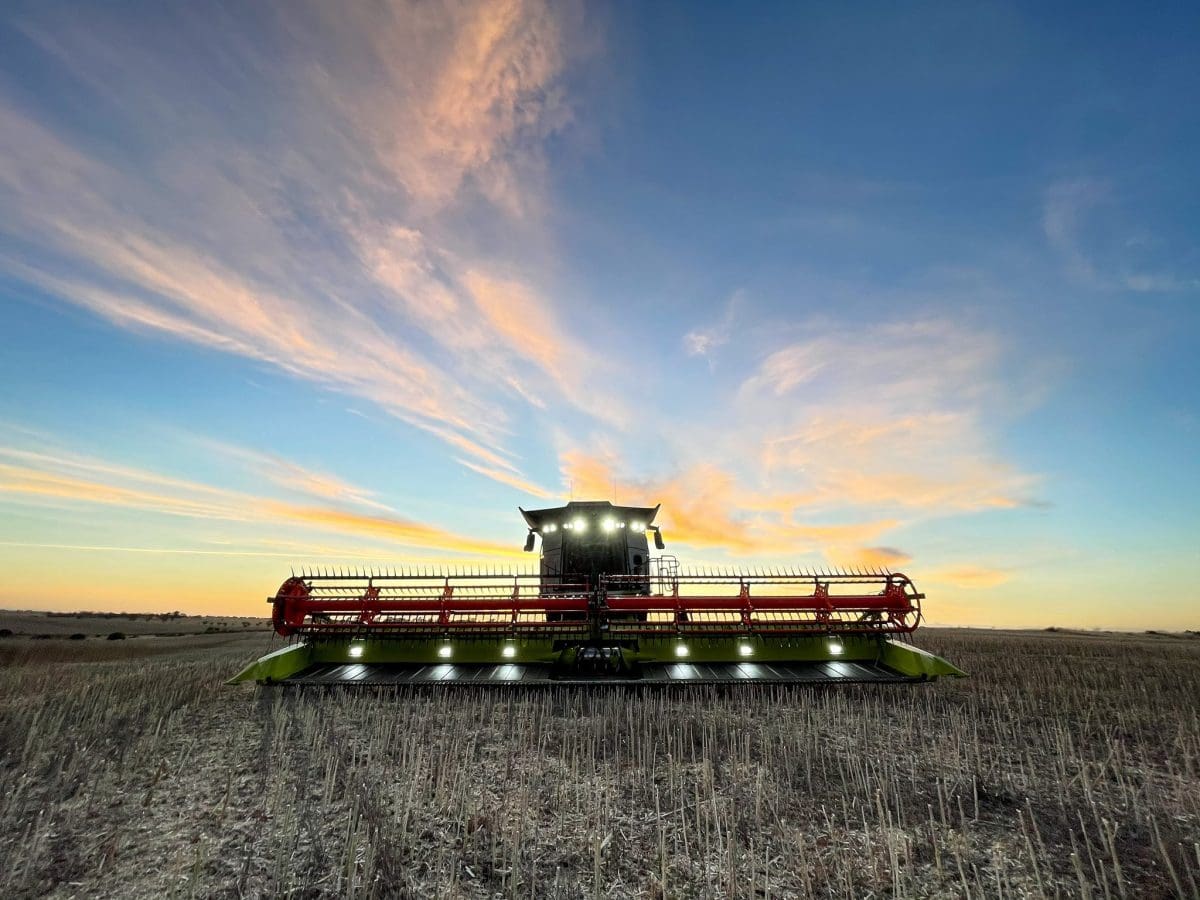
Harvesting canola at Northampton in WA’s Geraldton zone. Photo: Amery Drage
AUSTRALIA’s national commodity forecaster has lifted its estimates for new-crop wheat, barley and canola in its latest Australian Crop Report on the back of late rain in the growing season for south-eastern Australia.
Tempering the lift has been a tough finish to the Western Australian season, where production estimates have been cut for all three of Australia’s main winter crops.
Harvesting of all three crops is now roughly half on the mainland, with wheat now forecast to produce 31.2 million tonnes (Mt), barley 12Mt and canola 3.7Mt (tables 1, 3 and 5).
On wheat, that represents on increase of 8 per cent from the 28.9Mt forecast in ABARES previous crop report issued in September, while barley is up 7pc from 11.2Mt, and canola is up 8pc from 3.4Mt.
Following are ABARES tonnage and area estimates by state for Australia’s three largest winter crops:
| WHEAT tonnes | 5yr avg to 2019-20 | 2019-20 | 2020-21 Sep estimate | 2020-21 Dec estimate |
| Qld | 885,000 | 420,000 | 1,103,000 | 1,103,000 |
| NSW | 5,072,000 | 2,090,000 | 10,260,000 | 12,236,000 |
| Vic | 3,208,000 | 3,600,000 | 4,096,000 | 4,720,000 |
| Tas | 49,000 | 55,000 | 51,000 | 56,000 |
| SA | 4,018,000 | 3,200,000 | 4,500,000 | 4,900,000 |
| WA | 8,327,000 | 5,800,000 | 8,900,000 | 8,150,000 |
| TOTAL TONNES | 21,559,000 | 15,165,000 | 28,910,000 | 31,165,000 |
Table 1: Tonnes of wheat produced in all Australian states. Source: ABARES
| WHEAT area | 5yr avg to 2019-20 | 2019-20 | 2020-21 Sep estimate | 2020-21 Dec estimate |
| Qld | 538,000 | 400,000 | 750,000 | 750,000 |
| NSW | 2,651,000 | 1,900,000 | 3,800,000 | 3,800,000 |
| Vic | 1,419,000 | 1,450,000 | 1,600,000 | 1,600,000 |
| Tas | 9,000 | 10,000 | 10,000 | 10,000 |
| SA | 1,939,000 | 1,950,000 | 2,075,000 | 2,075,000 |
| WA | 4,444,000 | 4,500,000 | 4,750,000 | 4,750,000 |
| TOTAL HECTARES | 11,000,000 | 10,210,000 | 12,985,000 | 12,985,000 |
Table 2: Hectares planted to wheat in all Australian states. Source: ABARES
| BARLEY tonnes | 5yr avg to 2019-20 | 2019-20 | 2020-21 Sep estimate | 2020-21 Dec estimate |
| Qld | 238,000 | 60,000 | 270,000 | 240,000 |
| NSW | 1,654,000 | 696,000 | 2,518,000 | 3,040,000 |
| Vic | 2,027,000 | 2,500,000 | 2,349,000 | 2,741,000 |
| Tas | 28,000 | 45,000 | 30,000 | 39,000 |
| SA | 2,009,000 | 1,850,000 | 2,100,000 | 2,300,000 |
| WA | 3,958,000 | 3,850,000 | 3,950,000 | 3,600,000 |
| TOTAL TONNES | 9,914,000 | 9,001,000 | 11,217,000 | 11,960,000 |
Table 3: Tonnes of barley produced in all Australian states. Source: ABARES
| BARLEY area | 5yr avg to 2019-20 | 2019-20 | 2020-21 Sep estimate | 2020-21 Dec estimate |
| Qld | 107,000 | 45,000 | 135,000 | 135,000 |
| NSW | 807,000 | 580,000 | 950,000 | 950,000 |
| Vic | 869,000 | 820,000 | 870,000 | 870,000 |
| Tas | 7,000 | 10,000 | 7,000 | 7,000 |
| SA | 869,000 | 845,000 | 840,000 | 840,000 |
| WA | 1,651,000 | 1,750,000 | 1,600,000 | 1,600,000 |
| TOTAL HECTARES | 4,310,000 | 4,050,000 | 4,402,000 | 4,402,000 |
Table 4: Hectares planted to barley in all Australian states. Source: ABARES
| CANOLA tonnes | 5yr avg to 2019-20 | 2019-20 | 2020-21 Sep estimate | 2020-21 Dec estimate |
| Qld | 1,000 | 1,000 | 1,000 | 1,000 |
| NSW | 713,000 | 225,000 | 869,000 | 1,073,000 |
| Vic | 604,000 | 650,000 | 765,000 | 855,000 |
| Tas | 3,000 | 3,000 | 2,000 | 3,000 |
| SA | 296,000 | 300,000 | 330,000 | 375,000 |
| WA | 1,519,000 | 1,150,000 | 1,450,000 | 1,400,000 |
| TOTAL TONNES | 3,136,000 | 2,329,000 | 3,417,000 | 3,707,000 |
Table 5: Tonnes of canola produced in all Australian states. Source: ABARES
| CANOLA area | 5yr avg to 2019-20 | 2019-20 | 2020-21 Sep estimate | 2020-21 Dec estimate |
| Qld | 1,000 | 2,000 | 2,000 | 2,000 |
| NSW | 574,000 | 250,000 | 550,000 | 550,000 |
| Vic | 389,000 | 385,000 | 450,000 | 450,000 |
| Tas | 1,000 | 1,000 | 1,000 | 1,000 |
| SA | 199,000 | 220,000 | 225,000 | 225,000 |
| WA | 1,211,000 | 950,000 | 1,150,000 | 1,150,000 |
| TOTAL HECTARES | 2,375,000 | 1,808,000 | 2,378,000 | 2,378,000 |
Table 6: Hectares planted to canola in all Australian states. Source: ABARES
Source: ABARES
HAVE YOUR SAY