AUSTRALIA exported 588,122 tonnes of chickpeas and 410,805t of lentils in December, according to the latest data from the Australian Bureau of Statistics.
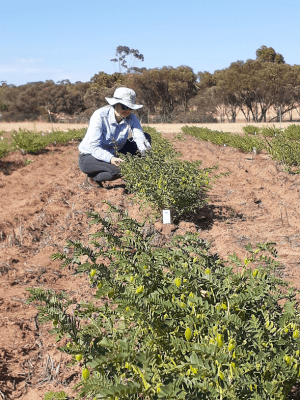
Western Australia’s Murdoch University is involved in a GRDC project looking at the ability of chickpea (pictured), lupin, and mungbeans to fix nitrogen. Photo: Legume Rhizobium Sciences, Murdoch University
The chickpea figure is up 57 percent from the November total of 373,959t, while the lentil figure has more than doubled from 183,790t shipped in November.
India was the biggest market by far for December-shipped chickpeas, taking 368,177t, or 63pc of the total.
Bangladesh on 106,735t and Pakistan on 96,094t were the second and third-biggest markets respectively for Australia’s December-shipped chickpeas.
On lentils, India with 159,067t and Bangladesh with 139,343t took 39pc and 24pc respectively of December shipments, with Pakistan on 53,762t the third-biggest market.
Traders say the depth of India’s buying has surprised the market.
It has had an 11pc tariff on chickpeas in place since April last year, and lentils are subject to the same, bar a most-favoured-nation quota of 150,000t spread equally across four quarters.
| CHICKPEAS | Oct | Nov | Dec | Tonnes |
| Bangladesh | 16412 | 89006 | 106735 | 212153 |
| Belgium | 0 | 0 | 425 | 425 |
| Canada | 888 | 1185 | 734 | 2807 |
| Germany | 0 | 0 | 18 | 18 |
| Greece | 0 | 24 | 0 | 24 |
| India | 39881 | 224422 | 368177 | 632480 |
| Israel | 0 | 25 | 0 | 25 |
| Italy | 0 | 245 | 146 | 391 |
| Japan | 20 | 0 | 135 | 155 |
| Malaysia | 168 | 408 | 1379 | 1955 |
| Mauritius | 96 | 146 | 125 | 367 |
| Nepal | 2306 | 1988 | 5680 | 9974 |
| Netherlands | 0 | 0 | 25 | 25 |
| New Zealand | 81 | 32 | 123 | 235 |
| Pakistan | 33547 | 30720 | 96094 | 160362 |
| Saudi Arabia | 0 | 250 | 250 | 500 |
| Singapore | 48 | 24 | 121 | 193 |
| South Africa | 0 | 24 | 0 | 24 |
| South Korea | 144 | 46 | 68 | 258 |
| Spain | 0 | 0 | 24 | 24 |
| Sri Lanka | 0 | 151 | 76 | 226 |
| Sweden | 0 | 0 | 50 | 50 |
| Thailand | 25 | 0 | 2 | 27 |
| Turkiye | 120 | 293 | 119 | 532 |
| UAE | 2896 | 23997 | 6457 | 33351 |
| UK | 796 | 683 | 910 | 2389 |
| US | 172 | 265 | 249 | 686 |
| Vietnam | 0 | 24 | 0 | 24 |
| TOTAL | 97600 | 373959 | 588122 | 1059681 |
Table 1: Australian chickpea exports for October, November and December 2025. Source: ABS
| LENTILS | Oct | Nov | Dec | Tonnes |
| Bahrain | 248 | 1007 | 701 | 1956 |
| Bangladesh | 22500 | 54566 | 139343 | 216410 |
| Canada | 2 | 0 | 0 | 2 |
| Egypt | 2252 | 8281 | 22917 | 33451 |
| India | 3140 | 97263 | 159067 | 259470 |
| Japan | 0 | 0 | 24 | 24 |
| Lebanon | 48 | 0 | 0 | 48 |
| Malaysia | 0 | 250 | 244 | 494 |
| Mauritius | 25 | 97 | 0 | 122 |
| Nepal | 1271 | 4640 | 10569 | 16480 |
| Netherlands | 0 | 20 | 0 | 20 |
| New Zealand | 22 | 15 | 27 | 65 |
| Pakistan | 9569 | 1142 | 53762 | 64473 |
| Singapore | 1 | 0 | 0 | 1 |
| South Africa | 0 | 0 | 24 | 24 |
| Sri Lanka | 5749 | 4332 | 18054 | 28135 |
| Turkiye | 0 | 126 | 125 | 251 |
| UAE | 479 | 12052 | 5946 | 18477 |
| US | 5 | 0 | 0 | 5 |
| TOTAL | 45311 | 183790 | 410805 | 639906 |
Table 2: Australian lentil exports for October, November and December 2025. Source: ABS
HAVE YOUR SAY