GLOBAL cotton consumption is expected to grow 3.5 per cent to almost 122 million bales in 2021-22, higher than the pre-pandemic 2018-19 level.
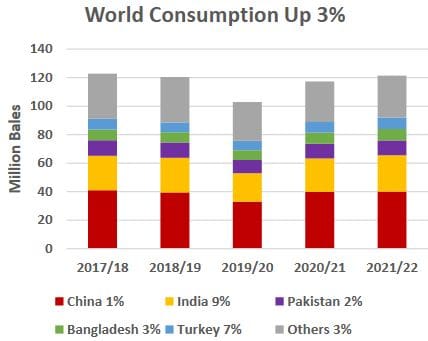
Chart 1. World cotton consumption is forecast to rise 3pc in 2021/22. Source: USDA
USDA’s first cotton forecast for 2021/22 (chart 1) shows recovery from the COVID-19 pandemic, though ongoing, will drive usage higher this year, but the figure will remain below the record 2017/18 consumption level.
World trade is expected to contract slightly in 2021-22 from 2020-21, which was the highest in eight years.
Australia’s 2021-22 exports are forecast to more than double, to 697,000 tonnes on dramatically higher production, with improved prospects relative to the extreme drought in 2020-21.
Shipments from the United States and Brazil (chart 2) are projected down on lower exportable supplies due to significantly lower carry-in.
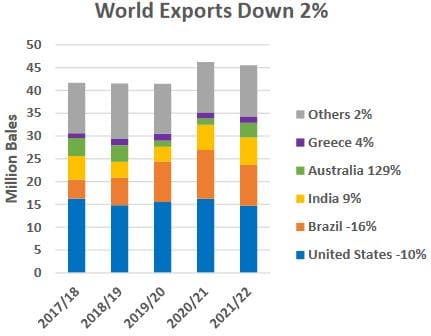
Chart 2. World cotton exports are forecast to decline 2pc in 2021/22. Source: USDA
India’s exports are up as higher world prices allow for the reduction of government-controlled stocks.
The second-highest projected global imports in nine years will be driven by higher global consumption relative to the previous year. China is projected to be the world’s largest importer for the second consecutive year, although imports are forecast lower than the previous year’s eight-year high. This follows the State Reserve’s expected return to replenishing stocks with foreign and domestic supplies. Pakistan imports are down slightly from the previous year’s record but significant due to the highest expected consumption level in three years and lower carry-in.
Global stocks have expanded again in the past three years to between 95pc and 75pc of total use, compared with the three years from 2016-17 when stocks represented less than 70pc of use.
Cotton price firms 40pc
The April 2021 cotton A-index was more than 40 percent higher compared with last year’s respective month, itself the lowest monthly average in 11 years.
The A-index and U.S. spot price (chart 3) have edged up slightly from April’s WASDE owing to dry weather in Texas and stronger commodity prices including corn, wheat, and soybeans.
Higher global consumption and lower global supplies since April 2020 have boosted prices.
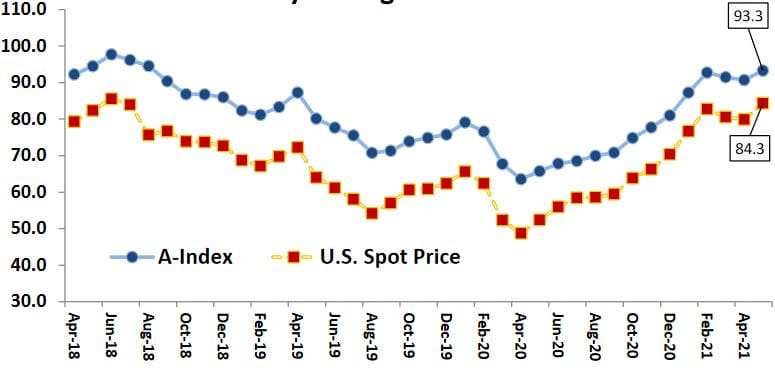
Chart 3. Cotton price index (blue line) and US spot price (red squares, US cents per pound) rose about 40 per cent from year-ago lows. Source USDA.
Source: USDA
Grain Central: Get our free daily cropping news straight to your inbox – Click here
HAVE YOUR SAY