BOTH the A-Index and New York futures prices for cotton have experienced exuberant rallies in recent months, reaching levels well above $1.00 per pound, according to the latest report from the United States Department of Agriculture (USDA).
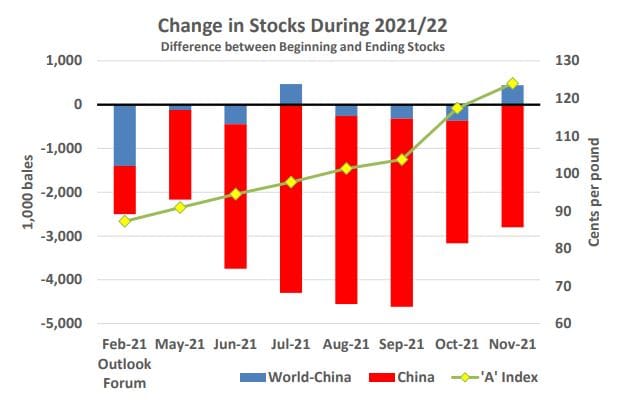
From the time of USDA’s first forecast for MY 2021/22 in February 2021 through September, the A-Index surged roughly 15 cents from the mid 80-cent range, coinciding with a tightening of world stocks in USDA’s projected balance sheet.
The February forecast for global 2021/22 ending stocks was 2.5 million bales lower than the previous year, with China accounting for roughly one-half of the downfall in global stocks.
By September, the decline in stocks had increased to 4.5 million bales, with China accounting for nearly all of the downfall, as expectations improved for recovery from the impacts of COVID.
USDA forecasts in October and November both show smaller reductions in world stocks as global production expanded, primarily in Brazil, Australia, Pakistan, and Turkey.
Coupled with lower global use in key markets, particularly in China and Vietnam, this has resulted in higher ending stocks than previously expected.
Despite the outlook for higher ending stocks than previous USDA forecasts, prices have surged over the last two months with the A-Index reaching nearly $1.30, the highest level in 10 years.

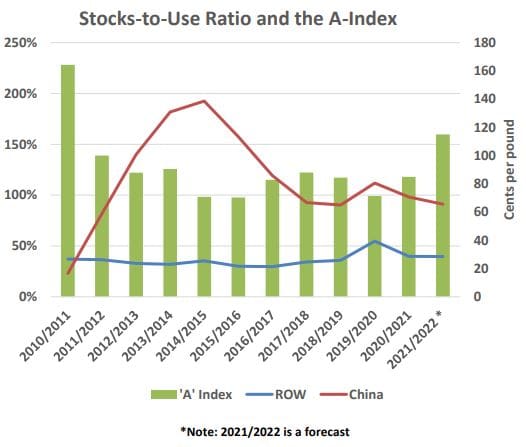
Compared to recent years, the USDA forecast for the marketing year average for the A-Index is relatively high ($1.17 cents per pound) relative to the stocks-to-use ratios for both China and the rest of the world.
The last time the A-Index averaged above $1.00 was in 2010/11 when China’s stocks-to-use ratio was 23 per cent compared with 91pc forecast for 2021/22; stocks-to-use for the rest of the world was 37pc compared with 40pc for 2021/22. In 2010/11, the A-Index rose from the mid-80s in August to $1.30 per pound in late October before peaking at $2.40 in April 2011.
The A-Index lost half its value within the next four months.
Source: USDA

HAVE YOUR SAY