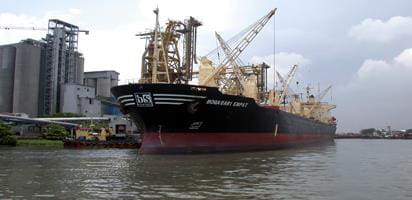
LEGACY prices from the drought are hurting Australia’s wheat export as traders struggle to win business in key consumer markets. April 2019 wheat exports published by the Australian Bureau of Statistics reported 743,984 tonnes (t) bulk and 86,336t containerised, making total 830,320t Australian wheat shipped in April, lower than the previous two months.
“Wheat container exports for April, at 86,336t, continue the trend of running at just above 40 per cent of the five-year average,” Market Check head of markets Nick Crundall said.
“Western Australia and South Australia remain the key states for container exports, making up 75pc of April export volume. This is not surprising though given the relative seasons between WA/SA and the eastern states.”
Bulk shipments pattern
“While the headline number for April was largely within expectation, digging into the data reveals the same pattern we’ve been seeing each month of this season.
“Western Australia has shouldered most of the export task, accounting for 75pc of overall volumes.
“Korea, Vietnam, The Philippines and Japan remain the stalwarts of our export program this year, with these three destinations accounting for 55 per cent of our total exports between October and April.”
But the detail of destinations taking Australia’s wheat this year is cause for concern because fresh business is hard to get booked, especially with price-sensitive customers in an extremely competitive global wheat market.
“In terms of destinations, we continue to see exports to Indonesia disappoint as they shift more and more to Black Sea/South American origin,” Mr Crundall said.
“To provide some context, if Indonesian exports don’t improve relative to other destinations before September 30th, 2018-19 will be the first season in 16 years that Indonesia wasn’t our biggest customer. “
Australia’s price competitiveness actually improved in the past month or two because its basis dropped. United States wheat futures trended lower over February and early March, then when futures began to rise Australia’s basis gradually halved, which would open the prospect of fresh export sales. To some limited extent that has turned the ship around.
Market analyst, Lachstock Consulting, said in its May wheat update the pace of exports had picked up in WA, though not sufficiently to meet target levels.
A temporary pick-up would be fortuitous because there’s usually a seasonal price inverse occurring in August and September as northern hemisphere new crop begin to ship, and Australia would expect its monthly export to drop during that time this year to 700,000t per month.
In the meantime April/July monthly shipments in the order of 850-900,000t would be necessary, it said.
Table 1 and Table 2 contain April wheat shipments by destination, along with February and March, for bulk and containerised exports.
| BULK | Feb | Mar | Apr | Tonnes |
|---|---|---|---|---|
| Fiji | 0 | 0 | 38909 | 38909 |
| Indonesia | 85594 | 93920 | 42024 | 221537 |
| Japan | 110772 | 76107 | 35070 | 221948 |
| Korea | 150150 | 143640 | 61600 | 355390 |
| Kuwait | 42029 | 46000 | 47026 | 135055 |
| Malaysia | 81875 | 0 | 26678 | 108554 |
| New Zealand | 27130 | 0 | 71379 | 98509 |
| Oman | 16500 | 33000 | 0 | 49500 |
| Papua New Guinea | 18000 | 35600 | 0 | 53600 |
| Philippines | 152582 | 235550 | 142041 | 530173 |
| Singapore | 0 | 0 | 18460 | 18460 |
| Sri Lanka | 248 | 0 | 1336 | 1584 |
| Thailand | 19541 | 0 | 55000 | 74541 |
| UAE | 0 | 22000 | 0 | 22000 |
| Vietnam | 0 | 58850 | 148711 | 207561 |
| Yemen | 48000 | 111375 | 55750 | 215125 |
| TOTAL | 752420 | 856042 | 743984 | 2352446 |
Table 1: ABS bulk wheat export data for Australia’s February, March and April 2019 shipments.
| BOXED | Feb | Mar | Apr | Total |
|---|---|---|---|---|
| Cambodia | 0 | 0 | 3 | 3 |
| China | 0 | 5417 | 19330 | 24747 |
| Egypt | 350 | 1852 | 3059 | 5261 |
| Fiji | 2302 | 3334 | 2926 | 8561 |
| Hong Kong | 0 | 24 | 0 | 24 |
| India | 0 | 499 | 0 | 499 |
| Indonesia | 1510 | 1334 | 1293 | 4138 |
| Japan | 410 | 380 | 0 | 790 |
| Korea | 520 | 63 | 0 | 582 |
| Malaysia | 17935 | 17322 | 16477 | 51735 |
| Myanmar | 22503 | 19741 | 7120 | 49365 |
| New Caledonia | 1598 | 1833 | 951 | 4381 |
| New Zealand | 3807 | 3289 | 2680 | 9776 |
| Papua New Guinea | 43 | 0 | 589 | 632 |
| Philippines | 4424 | 7965 | 4672 | 17061 |
| Saudi Arabia | 500 | 0 | 374 | 873 |
| Singapore | 1517 | 986 | 550 | 3052 |
| Solomon Islands | 750 | 2502 | 1251 | 4503 |
| Sri Lanka | 2057 | 0 | 0 | 2057 |
| Taiwan | 3704 | 5403 | 3341 | 12447 |
| Thailand | 13569 | 10733 | 11879 | 36181 |
| UAE | 137 | 56 | 55 | 248 |
| United Kingdom | 666 | 560 | 1156 | 2382 |
| Vietnam | 2885 | 10849 | 8634 | 22368 |
| TONNES | 81188 | 94142 | 86336 | 261666 |
Table 2: ABS containerised wheat export data for Australia’s February, March and April 2019 shipments.
Source: ABS
HAVE YOUR SAY