WORLD grains and oilseeds prices, which began to rally hard late in August, booked another month of solid gains in October, according to the monthly global market report of the International Grains Council (IGC) published last week (Figure 1).
 The price rises have occurred despite world supply and world trade nudging records, which would normally be expected to depress prices.
Importers buying greater quantities from exporters amid rising consumption is the component of the equation which helps to explain the rise in price.
IGC’s grains and oilseeds (GOI) price index lifted 8 per cent last month to its highest point in more than six years.
The index comprises four sub-indices, and rice was the only one to drop in October.
It fell 1pc, while wheat and soybeans rose 7pc and 8pc respectively, and corn jumped 18pc.

Figure 1. IGC grains and oilseeds price index (GOI) dwelt most of the past year below 200, before rising strongly to its recent high of 242. Index 100 equals January 2000. Source: International Grains Council. See note 1. Click image to expand.
The wheat sub-index broached its highest level since January 2015 amid dry-weather worries, including dryness for 2021-22 winter crops in Russia and the US.
The corn sub-index has surged over the past five weeks. The rally was linked to declining crop prospects in Ukraine, tighter than expected 2019-20 US stocks and concerns about difficult sowing conditions in South America. The total gain over 12 months in the corn sub-index was 38pc.
Soybean price support stemmed from dwindling old-crop supplies and planting delays in Brazil, as well as solid demand for US exports, mainly from China.
Total supply strong, usage and trade record
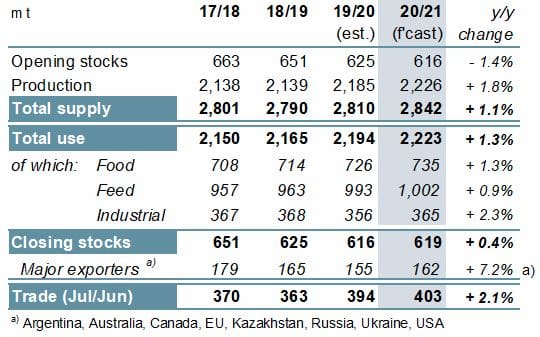
Prices have risen strongly, despite almost every measure of grains and oilseed supply pointing to greater quantities available (Figure 2).
While it can be argued that corn and wheat ending stocks in the hands of major exporters are low, the global total figures for wheat production, use, trade and ending stocks are seen higher in 2020-21 than in 2019-20.

Figure 2. IGC world total grain supply/demand. The 2020-21 crop year is projected to increase every metric of the supply-demand equation according to the October 2020 world total grain supply-demand data from IGC which covers corn, rice, soybeans and wheat. Source: IGC see note 2. Click image to expand.
Global soybean production at 370 million tonnes (Mt) will be a record in 2020-21, consumption will be at a record 370Mt and US exports are forecast at a record 60Mt.
Grains consumption in 2020/21, at 2,223Mt will be a record, a rise of 1.3pc from previous year. It includes gains of food use, 10Mt, feed use, 9Mt, industrial and other use, 10Mt.
The all-grains world trade forecast in 2020/21, at 403Mt, is higher mainly as a result of greater quantities of wheat imports by China and Pakistan and corn imports by the EU and China.
Note 1; Commodity prices for wheat, soybean, sorghum, rice, rapeseed, corn and barley contribute to the daily IGC Grains and Oilseeds Index. Each commodity’s component weighting is based on its five-year average share of total trade.
Note 2; EU-28 data apply until 2019/20. EU-27 apply from 2020/21. The y/y percentage change is basis EU-27.

HAVE YOUR SAY