WATCHERS of wheat stock and production numbers saw something big reverberate on January 8 when the Australian Bureau of Statistics (ABS) survey data for last year’s crop area and production were released.
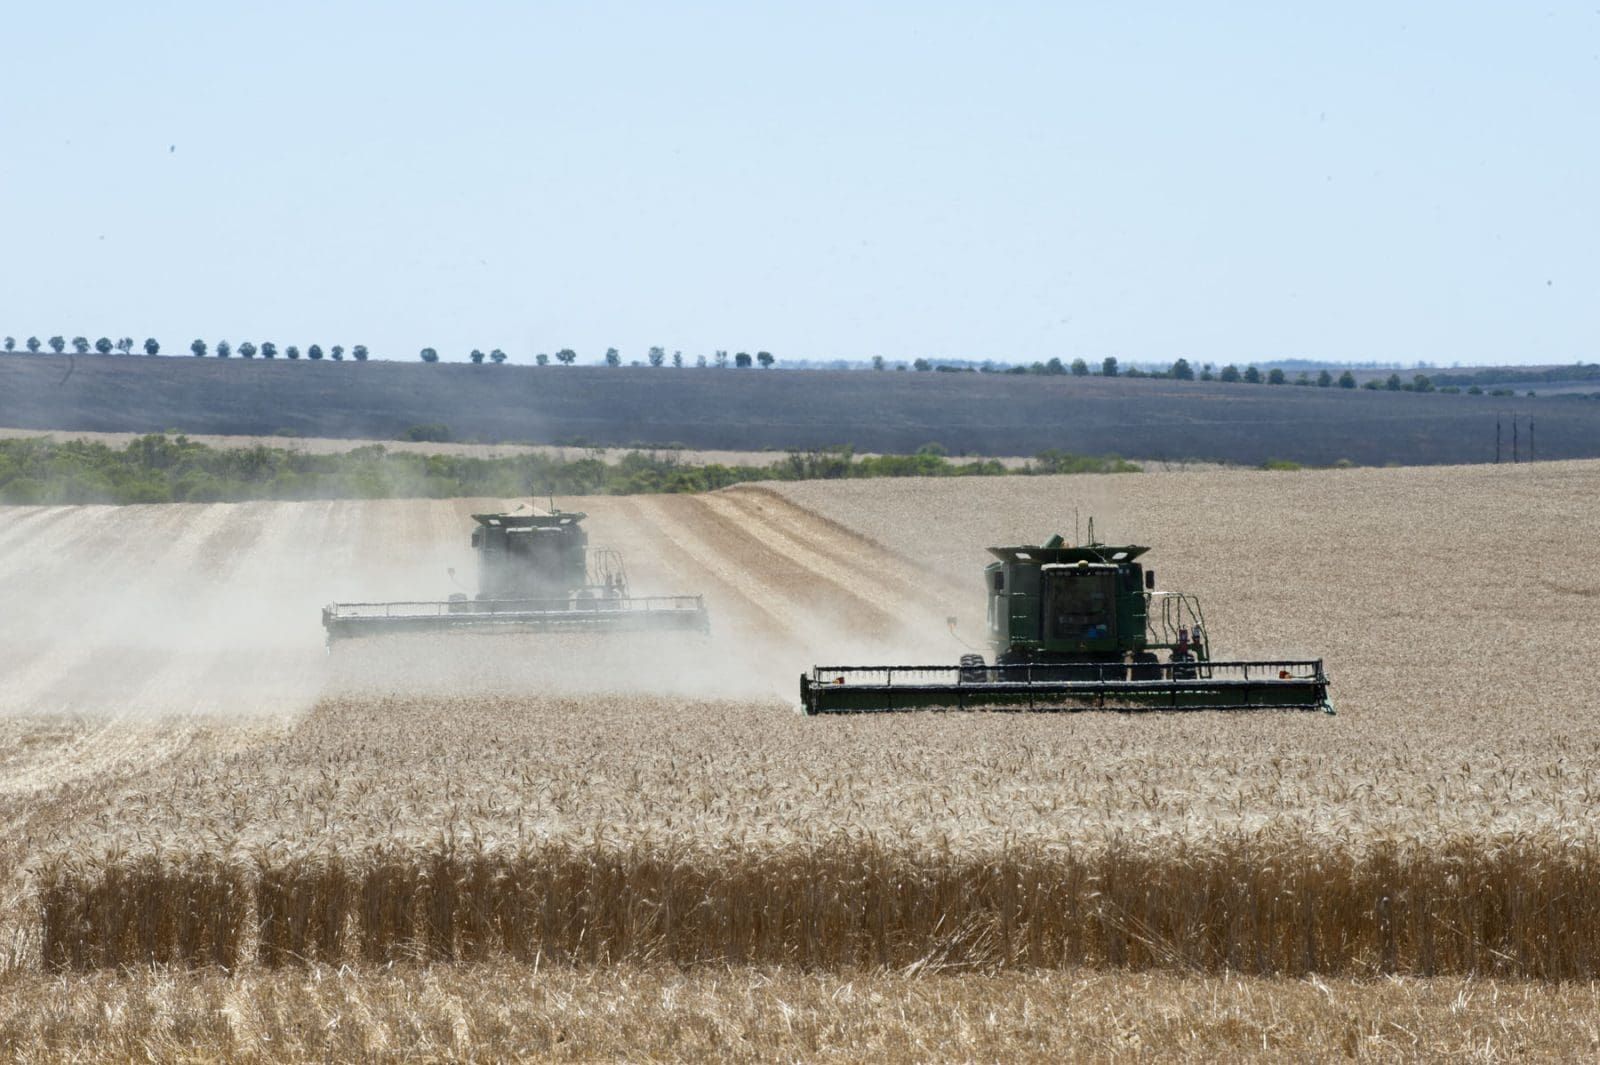
Photo: DAFWA
The survey results generated a figure of 30 million tonnes (Mt) production from the 2016 wheat crop, 5Mt below the production estimate published by the Government commodity forecaster ABARES (Australian Bureau of Agricultural and Resources Economics and Sciences) the previous month, and well below market expectations.
News moves markets
Such news moves markets, but also raises questions about the integrity of data.
The United States Department of Agriculture (USDA) publishes its hugely influential World Agricultural Supply and Demand Estimates (WASDE) monthly.
The USDA was timed to publish its estimates on January 12, and it could not ignore Australia’s news of major revisions to crop estimates a year after harvest, so it did the best it could by trimming and tacking its 2016 figures, and lopped 3Mt from Australia’s contribution to last year’s world production. While attempting to maintain integrity of its 2017 figures it needed to cut Australia’s export contribution by 1.5Mt in 2017/18.
World wheat prices lifted as markets absorbed the impact of the WASDE, along with trade and world crop influences in the northern hemisphere winter/spring outlook.
Stocks data sketchy
Industry sources have said that while grain receivals-into-storage (stock data) in Western Australia give a higher degree of reliability of overall production forecasting in WA than in other states, massive investment in on-farm storage had increased the difficulty of reliable production forecasting across the country.
While US agencies publish thorough supply-and-demand analyses, the same cannot be said for the Australian agencies, encumbered perhaps with unhelpful rules.
The missing link is stock; availability of supply as carryover from one crop year to the next. For as long as there is no means of collecting, those additional lines of data will feed embarrassing, market-moving, late changes.
Hands up wheat growers, traders, consumers?
Footnote: ABS report here. It includes numbers on other crops and livestock. The crop estimates for barley, canola, grain sorghum and oats are understood to be subject to methodology similar to that used to estimate wheat.
About the ABS REACS survey: The ABS survey was a Rural Environment and Agricultural Commodities Survey (REACS). The REACS is conducted annually in the years between the five-yearly Agricultural Census, which is what was done in 15/16. The scope for the 2016-17 REACS was all agricultural businesses with an EVAO of $40,000 or greater. This is a change from previous ABS REACS collections, where a scope of EVAO of $5,000 or greater was used, but is a continuation of the scope used in the 2015-16 Agricultural Census. The 2016-17 REACS preliminary estimates are based on an achieved response rate of 77.8% from a sample of 30,466 agricultural businesses selected. ABS suggests the relative standard error (RSE) for wheat-barley-canola ranges between 2-5% depending on state and commodity. ABS update will appear as report catalogue number 7121 in about 6 months.
ABARES will issue its next Australian Crop Report on 13 February 2018.
HAVE YOUR SAY