SINCE the 2021-22 wheat crop worldwide is largely in the bin and therefore a known quantity, Australia’s weather uncertainties notwithstanding, the publication of USDA’s projections overnight that cut world ending stocks has made analysts and wheat users sit up and pay attention.
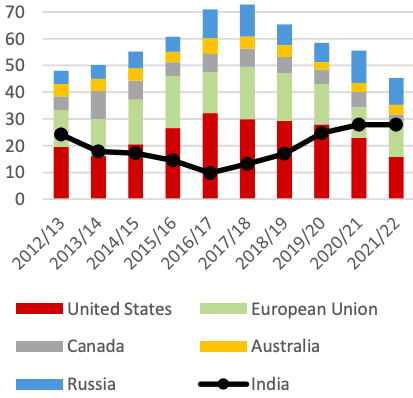
The major exporters’ stocks (Figure 1) are set to decline in again 2021-22, representing tighter supplies available to the global market. Owing to drought-affected production, United States and Canada stocks are expected to draw down to the lowest level since 2007-08, despite lower exports from both countries.
While Ukraine’s stocks remain steady, Russian stocks are set to decline with its smaller crop and strong exports to the Middle East. Stocks in the European Union and Australia are also expected to decline due to exceptionally high exports.

Figure 1. Rising wheat inventory in India (black line) counters stock decline among major exporters (columns) over four years. Million tonnes Source: USDA
India’s stocks balloon
India’s wheat stocks have moved in the opposite direction to the major exporters, and now account for 10 per cent of global stocks.
Over the past several years, production in India has been rising with increasing domestic procurement prices, and its government has boosted purchases of wheat for its food-security programs.
With larger crops and government procurement, India’s wheat stocks have ballooned well above desired buffer-stock levels.
Tightening global supplies and high prices from major exporters have made Indian wheat competitive for the first time in several years.
Indian wheat export prices averaged an attractive $265 per tonne in August, and have the advantage of lower freight rates to nearby countries.
India’s wheat exports are forecast to be almost 50pc higher than last year, and nearly nine times higher than two years ago. If realised, its exports would be the highest since 2013-14.
China stocks decline
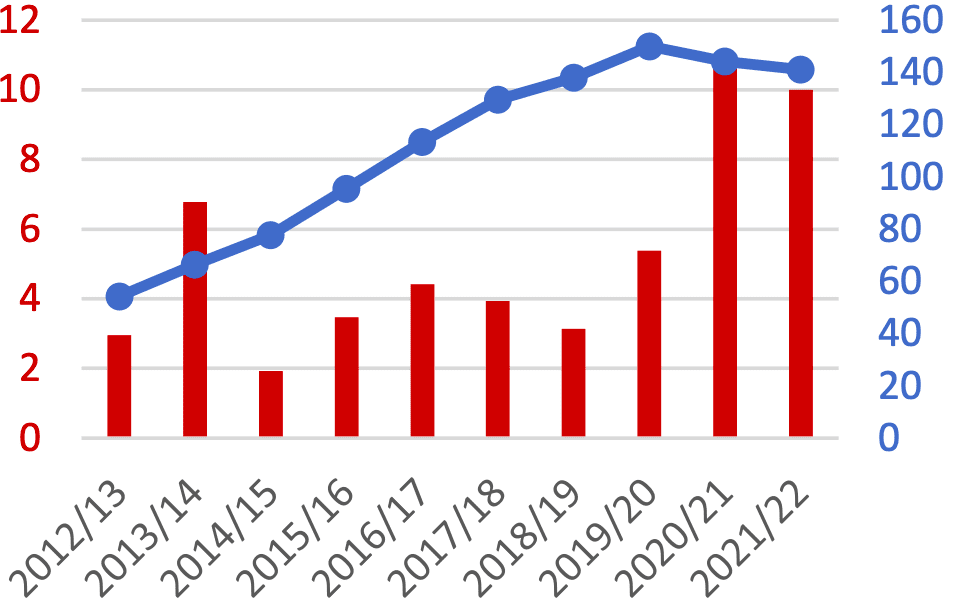
Wheat stocks in China (Figure 2) declined in 2020/21 for the first time in over a decade. About one-half of global stocks are held by China, and generally have not played a significant role in the global market.
Over the past year, high feed demand has prompted China to offload some of the multi-year-old government-held stocks into the domestic market via auctions.
Meanwhile, China’s import demand for milling-quality wheat has soared, propelling it to become the second-largest importer. Imports are forecast at high levels again in 2021-22, with China forecast as the fourth-largest importer.

Figure 2. China wheat stock (blue numbers right axis) is projected to decrease slightly following ~100Mt increase, aided in part by hefty imports (red columns left axis numbers) which last year topped record 10Mt. Source USDA
Sharp price rise
Reported elsewhere following the WASDE and other report publications overnight, market price responses have been coming for quite some time, spurred by publicity of drought in Canada and dryness in many parts of East Asia, but the confluence of two years of less-than-ideal bread wheat and durum crops is causing significant price impact on food.
Wheat prices have risen sharply over the past several months, reflecting strong consumption growth despite relatively flat global production.
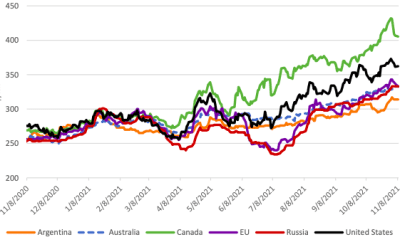
They continued to climb throughout October (Figure 3) as international demand remained high despite tight supplies from some major exporters, though prices have settled lower the past few days. Canada had the largest increase as supplies are constrained by a significantly smaller crop. Canadian quotes peaked at a new high before dipping in November and settling up $24/t from the prior month. US quotes followed a similar trend, up $4/t from the prior month. U.S. farm and futures prices have risen to the highest levels since 2012/13, reflected in the highest export quotes since the same period. EU and Russian export quotes rose $15/t and $19/t respectively on large tenders, especially from the Middle East and North Africa. Australian quotes rose $12/t and Argentine quotes rose $8/t ahead of their new crops.

Figure 3: Export FOB wheat bids November 2020 to November 2021. Canada began to break away in spring 2021 and by summer had completely separated itself, along with US, from the rest of the world export group. US$ per tonne. Source: IGC in USDA publication
Note on FOB prices: Argentina 12.0 per cent protein, up river; Australia average of APW; Kwinana, Newcastle, and Port Adelaide; Russia Black Sea milling; EU France grade 1, Rouen; US HRW 11.5% Gulf; Canada CWRS 13.5 per cent protein, Vancouver.
SandD background
Production was down sharply from last year among several of the major suppliers, including Canada, the US, Kazakhstan, and Russia.
While somewhat offset by larger crops in the EU, Ukraine, and Argentina, strong global demand is a major factor leading to tighter global stocks.
Import demand is surging as dry weather in the Middle East spurs additional imports, especially for Iran and Turkey.
Tendering from the Middle East and North Africa has been robust especially over the past month despite global wheat prices significantly higher than last year.
Global production is down this month with lower estimates for the EU, United Kingdom, and Turkey, only partly offset by an upward revision for Russia.
Global consumption is raised this month. Ending stocks are adjusted to the lowest in five years with downward revisions in India and the EU.
Global trade is forecast higher with imports raised for Iran, Turkey, Algeria, and Saudi Arabia. Exports are lifted for the EU, Russia, and India.
Source: USDA

HAVE YOUR SAY