WHETHER the weather is good or whether the weather is bad, this time of year, every year, global grain markets are driven by climatic anomalies. More than 94 per cent (pc) of the world’s winter and spring crops are grown in the northern hemisphere and the crop is filling, finishing and harvested over this critical period.
Sometimes these anomalies are kind, like the 2016/17 season where there were very few major crop hiccups, and exceptional growing conditions led to records being broken across the globe, in both winter and summer crop production.
This season, the weather gods are playing a very different tune.
In the United States (US), drought conditions across the major spring wheat areas will push the countries wheat production down year-on-year. In the latest World Agricultural Supply and Demand Estimates (WADSE) report, released on July 12, the USDA pegged US production at 47.9 million tonnes (Mt). A lot of water has passed under the bridge in the ensuing weeks and that number is likely to be further downgraded as lower than anticipated yields reported in recent crop tours and abandonment figures are taken into account.
North of the border, dryness through the southern parts of Canada, in particular Saskatchewan, was reflected in a 10 pc, year-on-year, reduction in the WADSE wheat production forecast, to 28.4Mt. Conditions have certainly not improved through July and that number could easily be on the high side come harvest.
In Europe, the early spring dryness through Spain and France have led to disappointing yields and downward revisions to the European Union (EU) crop in recent weeks, but still higher than last season. To add insult to injury, unrelenting rainfall in many parts of Germany over the past few weeks is raising concerns over production and quality in that part of the EU.
Further east in Russia, there is talk of production topping last year’s 73Mt record, as average yields from the early harvest are reported to be a tad higher than 2016. In the Ukraine, harvest reports are quite mixed with some areas reporting much higher yields than last year and other areas the opposite. Overall, production is widely expected to be around 10 per cent lower than last year at 24Mt.
Wheat production in India is set to rebound year-on-year after a poor 2016/17 crop led to a substantial increase in imports, a market into which Australian exporters widely participated. Current 2017/18 forecasts suggest a 10 per cent increase in production to 96Mt.
Here in Australia the dry conditions across most of the grain growing regions are not a new story. The harsh reality is that domestic wheat production is probably less than 20Mt today and getting smaller. It will certainly be less than the 23.5Mt forecast in last month’s WADSE report.
So, how do all the production changes impact two of the key wheat market drivers, world ending stocks and the stocks-to-use ratio?
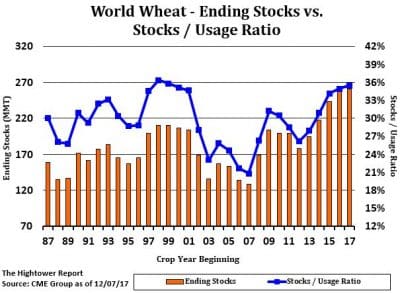
 The graph at left reflects the July WADSE numbers and shows both indices continuing their four year upward trend. World ending stocks were forecast to increase by 2.5Mt year-on-year, to 258Mt, despite lower world production. This was primarily due to the increased carry in stocks offsetting most of the forecast decrease in supply.
The stocks-to-use ration measures the level of ending stocks as a ratio of use, or consumption, of the underlying commodity. At more than 35 per cent for wheat, the ratio it is certainly in an historically healthy position.
There will undoubtedly be further downward revisions to the WADSE production numbers as reality hits the bin through the northern hemisphere harvest, and the extent of the Australian issues are realised. That said, a substantial decrease in world wheat production would be required to push either the ending stocks or the stocks-to-use ratio into bullish territory.
Source: Nidera Australia Weekly Market Report.
Peter McMeekin is Nidera Australia’s origination manager.


HAVE YOUR SAY