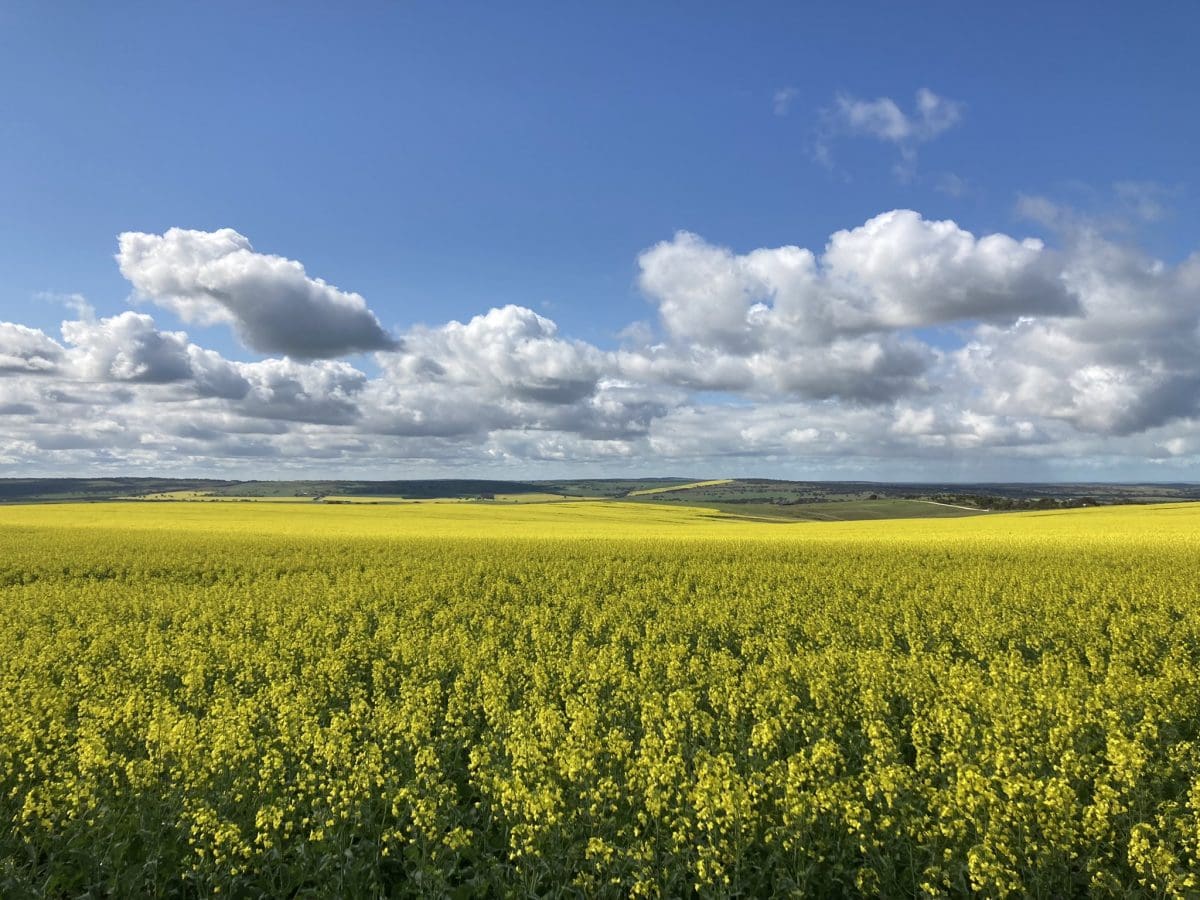
A canola crop in South Australia, where ABARES has increased production wheat, barley and canola estimates in its latest Australian Crop Report from preliminary figures released in June. Photo: James Stacey, Strathalbyn
ABARES has forecast Australia’s new-crop wheat production at 32.6 million tonnes (Mt), barley at 12.5Mt and canola at a record 5Mt in its Australian Crop Report September released overnight.
The wheat figure is up 17 per cent from the preliminary estimate released in June of 27.8Mt on the back of increased yield estimates for all mainland states.
This is despite Queensland’s wheat area being down on the June figure because of a late finish to Central Queensland’s grain sorghum season, and its below-average rainfall for the season.
Improved yield outlooks for all states and a modest increase in area in Queensland, Victoria, Tasmania and Western Australia saw the barley production estimate rise 20pc from the 10.4Mt forecast in June, and more than counter a drop in South Australian plantings.
On canola, production estimates have lifted for all mainland states, and the national crop is now expected to be 20pc bigger than the 4.2Mt forecast in June.
A 14pc increase in estimated planted area in NSW and a lift in the forecast yield in WA are the main drivers for the expected increase for canola.
| WHEAT PRODUCTION | 5yr avg to 2020-21 | 2019-20 | 2020-21 | 2021-22 Jun estimate | 2021-22 Sep estimate |
| Qld | 842,000 | 418,000 | 1,103,000 | 1,450,000 | 1,763,000 |
| NSW | 6,251,000 | 1,772,000 | 13,110,000 | 8,880,000 | 11,100,000 |
| Vic | 3,821,000 | 3,714,000 | 4,768,000 | 3,329,000 | 3,700,000 |
| Tas | 47,000 | 44,000 | 56,000 | 60,000 | 70,000 |
| SA | 4,140,000 | 2,689,000 | 4,800,000 | 4,100,000 | 4,500,000 |
| WA | 8,533,000 | 5,842,000 | 9,500,000 | 10,000,000 | 11,500,000 |
| TOTAL TONNES | 23,634,000 | 14,479,000 | 33,337,000 | 27,819,000 | 32,633,000 |
Table 1: Tonnes of wheat produced in all Australian states. Source: ABARES
| WHEAT AREA | 5yr avg to 2020-21 | 2019-20 | 2020-21 | 2021-22 Jun estimate | 2021-22 Sep estimate |
| Qld | 575,000 | 441,000 | 750,000 | 870,000 | 750,000 |
| NSW | 2,871,000 | 2,132,000 | 3,800,000 | 3,700,000 | 3,700,000 |
| Vic | 1,467,000 | 1,429,000 | 1,600,000 | 1,500,000 | 1,520,000 |
| Tas | 8,000 | 7,000 | 10,000 | 12,000 | 15,000 |
| SA | 1,954,000 | 1,721,000 | 2,075,000 | 2,075,000 | 2,075,000 |
| WA | 4,397,000 | 4,133,000 | 4,750,000 | 4,900,000 | 4,900,000 |
| TOTAL HECTARES | 11,272,000 | 9,863,000 | 12,985,000 | 13,057,000 | 12,960,000 |
Table 2: Hectares of wheat planted in all Australian states. Source: ABARES
| BARLEY PRODUCTION | 5yr avg to 2020-21 | 2019-20 | 2020-21 | 2021-22 Jun estimate | 2021-22 Sep estimate |
| Qld | 215,000 | 80,000 | 240,000 | 240,000 | 377,000 |
| NSW | 1,838,000 | 916,000 | 3,230,000 | 2,115,000 | 2,655,000 |
| Vic | 2,486 ,000 | 3,117,000 | 2,784,000 | 1,992,000 | 2,300,000 |
| Tas | 28,000 | 23,000 | 39,000 | 19,000 | 45,000 |
| SA | 2,175 ,000 | 1,995,000 | 2,400,000 | 1,900,000 | 2,200,000 |
| WA | 4,218 ,000 | 3,996,000 | 4,400,000 | 4,100,000 | 4,900,000 |
| TOTAL TONNES | 10,960 ,000 | 10,127,000 | 13,093,000 | 10,366,000 | 12,477,000 |
Table 3: Tonnes of barley produced in all Australian states: Source: ABARES
| BARLEY AREA | 5yr avg to 2020-21 | 2019-20 | 2020-21 | 2021-22 Jun estimate | 2021-22 Sep estimate |
| Qld | 114,000 | 80,000 | 135,000 | 120,000 | 130,000 |
| NSW | 865,000 | 885,000 | 950,000 | 900,000 | 900,000 |
| Vic | 931,000 | 1,102,000 | 870,000 | 830,000 | 850,000 |
| Tas | 6,000 | 5,000 | 7,000 | 5,000 | 10,000 |
| SA | 930,000 | 1,061,000 | 860,000 | 860,000 | 850,000 |
| WA | 1,726,000 | 1,907,000 | 1,600,000 | 1,530,000 | 1,600,000 |
| TOTAL HECTARES | 4,572,000 | 5,040,000 | 4,422,000 | 4,245,000 | 4,340,000 |
Table 4: Hectares of barley planted in all Australian states. Source: ABARES
| CANOLA PRODUCTION | 5yr avg to 2020-21 | 2019-20 | 2020-21 | 2021-22 Jun estimate | 2021-22 Sep estimate |
| Qld | 1,000 | 1,000 | 1,000 | 2,000 | 4,000 |
| NSW | 737,000 | 206,000 | 1,073,000 | 1,050,000 | 1,360,000 |
| Vic | 752,000 | 731,000 | 950,000 | 734,000 | 900,000 |
| Tas | 3,000 | 2,000 | 3,000 | 5,000 | 3,000 |
| SA | 315,000 | 241,000 | 375,000 | 320,000 | 370,000 |
| WA | 1,577,000 | 1,117,000 | 1,650,000 | 2,100,000 | 2,400,000 |
| TOTAL TONNES | 3,385,000 | 2,298,000 | 4,052,000 | 4,211,000 | 5,037,000 |
Table 5: Tonnes of canola produced in all Australian states: Source: ABARES
| CANOLA AREA | 5yr avg to 2020-21 | 2019-20 | 2020-21 | 2021-22 Jun estimate | 2021-22 Sep estimate |
| Qld | 1,000 | 1,000 | 2,000 | 2,000 | 2,000 |
| NSW | 586,000 | 327,000 | 550,000 | 700,000 | 800,000 |
| Vic | 428,000 | 405,000 | 450,000 | 500,000 | 460,000 |
| Tas | 1,000 | 1,000 | 1,000 | 2,000 | 1,000 |
| SA | 200,000 | 153,000 | 225,000 | 220,000 | 230,000 |
| WA | 1,262,000 | 1,148,000 | 1,150,000 | 1,550,000 | 1,550,000 |
| TOTAL HECTARES | 2,478,000 | 2,035,000 | 2,378,000 | 2,974,000 | 3,043,000 |
Table 6: Hectares of canola planted in all Australian states. Source: ABARES
Source: ABARES
Grain Central: Get our free daily cropping news straight to your inbox – Click here
HAVE YOUR SAY