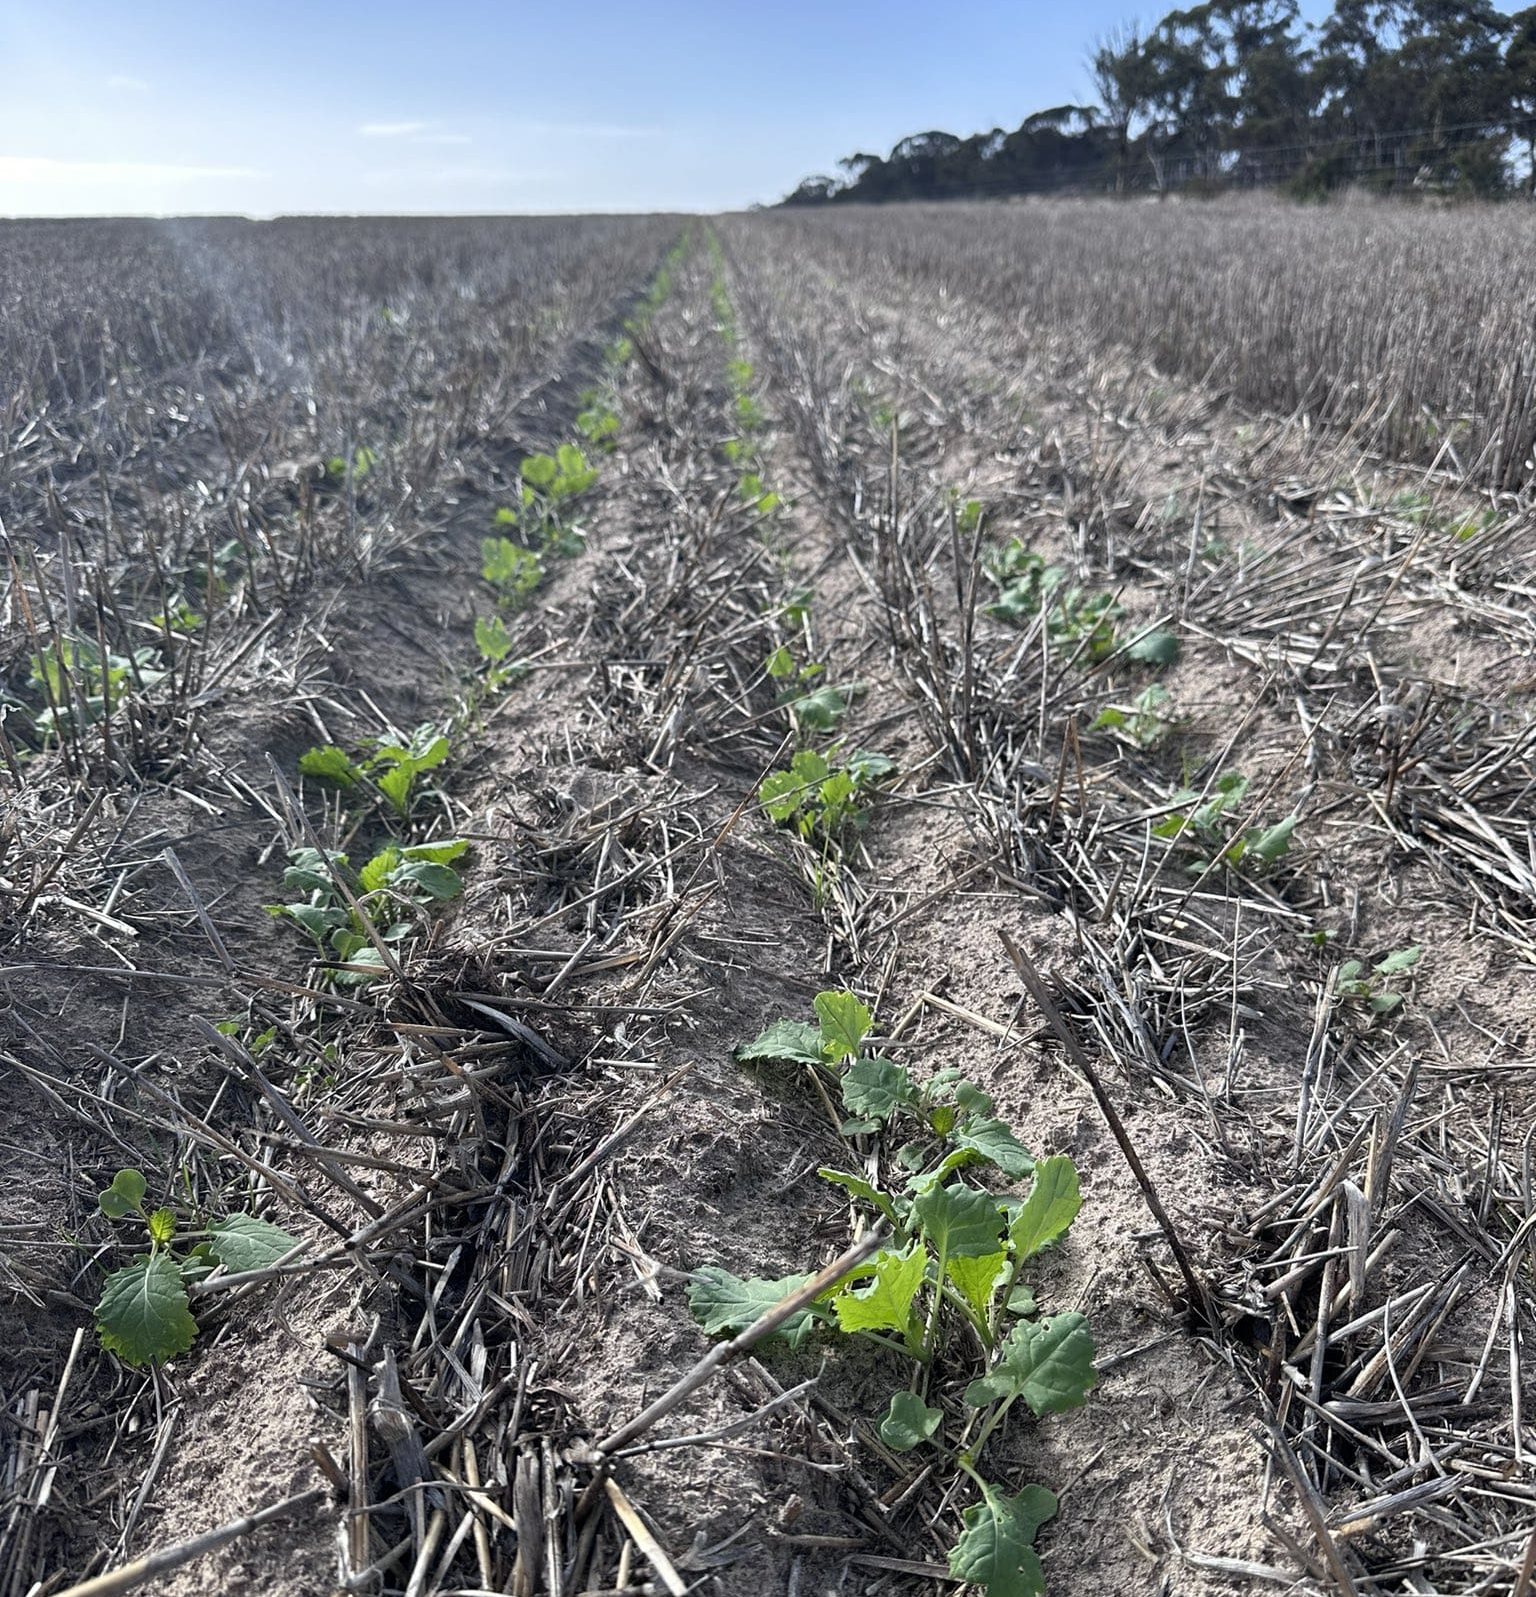
An establishing canola crop in good form the Salmon Gums district of WA’s Esperance Zone. Photo: Tim Starcevich
AUSTRALIA is forecast to produce 29.1 million tonnes (Mt) of wheat, 11.5Mt of barley and 5.4Mt of canola from the winter crop now being sown.
The figures have been released today in ABARES June Australian Crop Report, which reveal the national forecaster’s initial estimates by commodity and state of production.
Area planted to winter crops in Australia is forecast to remain historically high in 2024-25, rising slightly to 23.6 million hectares (Mha), 6 percent above the 10-year average to 2023-24.
A forecast increase in area planted to winter crops in Queensland and New South Wales is likely to more than offset a fall in area in Victoria, South Australia and Western Australia.
Area planted to wheat is forecast to rise by 3pc year on year to 12.7Mha in 2024-25, and barley area at 4.3Mha is seen as being up 3pc, mostly reflecting an increase in Qld and northern NSW area after a dry season last year.
“The longer planting window for cereals is also expected to result in some late plantings following upcoming forecast rainfall events.
Area planted to canola is forecast to fall 9pc to 3.2Mha, with lower relative expected returns have also seen some substitution towards other crops, including wheat, barley and pulses.
“The reduction in (canola) area reflects a less favourable start to the season in some major cropping regions.”
Above-average winter-crop production is expected, with most regions showing an increased likelihood of receiving average to above-average winter rainfall.
Yields are forecast to be above average in Qld, NSW and Vic which is likely to more than offset average to below average yields in South Australia and Western Australia.
Wheat production is forecast to increase by 12pc to 29.1Mt in 2024-25, 10pc above the 10-year average to 2023-24.
Barley production is forecast to increase by 7pc to 11.5Mt in 2024-25, 2pc above the 10-year average, while canola production is forecast to fall by 5pc to 5.4Mt, 21pc above the 10-year average.
| WHEAT | 2023-24 ha | 2023-24 tns | 2024-25 ha | 2024-25 tns |
| Qld | 720,000 | 1,080,000 | 840,000 | 1,800,000 |
| NSW | 3,300,000 | 7,095,000 | 3,600,000 | 9,800,000 |
| Vic | 1,540,000 | 5,200,000 | 1,500,000 | 4,347,000 |
| Tas | 12,000 | 85,000 | 10,000 | 60,000 |
| SA | 2,200,000 | 4,800,000 | 2,100,000 | 4,590,000 |
| WA | 4,650,000 | 7,700,000 | 4,700,000 | 8,500,000 |
| TOTAL | 12,422,000 | 25,960,000 | 12,750,000 | 29,097,000 |
Table 1: Australia’s 2023-24 wheat hectares and tonnes produced, and initial estimates for 2024-25. Source: ABARES
| BARLEY | 2023-24 ha | 2023-24 tns | 2024-25 ha | 2024-25 tns |
| Qld | 150,000 | 300,000 | 170,000 | 450,000 |
| NSW | 800,000 | 1,920,000 | 870,000 | 2,500,000 |
| Vic | 830,000 | 2,780,000 | 850,000 | 2,492,000 |
| Tas | 7,000 | 50,000 | 6,000 | 30,000 |
| SA | 800,000 | 2,050,000 | 800,000 | 1,950,000 |
| WA | 1,600,000 | 3,700,000 | 1,650,000 | 4,100,000 |
| TOTAL | 4,187,000 | 10,800,000 | 4,346,000 | 11,522,000 |
Table 2: Australia’s 2023-24 barley hectares and tonnes produced, and initial estimates for 2024-25. Source: ABARES
| CANOLA | 2023-24 ha | 2023-24 tns | 2024-25 ha | 2024-25 tns |
| Qld | 4,000 | 4,000 | 5,000 | 8,000 |
| NSW | 840,000 | 1,345,000 | 830,000 | 1,600,000 |
| Vic | 550,000 | 1,260,000 | 520,000 | 1,057,000 |
| Tas | 3,000 | 2,000 | 2,000 | 4,000 |
| SA | 290,000 | 570,000 | 260,000 | 470,000 |
| WA | 1,800,000 | 2,500,000 | 1,550,000 | 2,250,000 |
| TOTAL | 3,487,000 | 5,681,000 | 3,167,000 | 5,385,000 |
Table 3: Australia’s 2023-24 canola hectares and tonnes produced, and initial estimates for 2024-25. Source: ABARES
SOURCE: ABARES

HAVE YOUR SAY