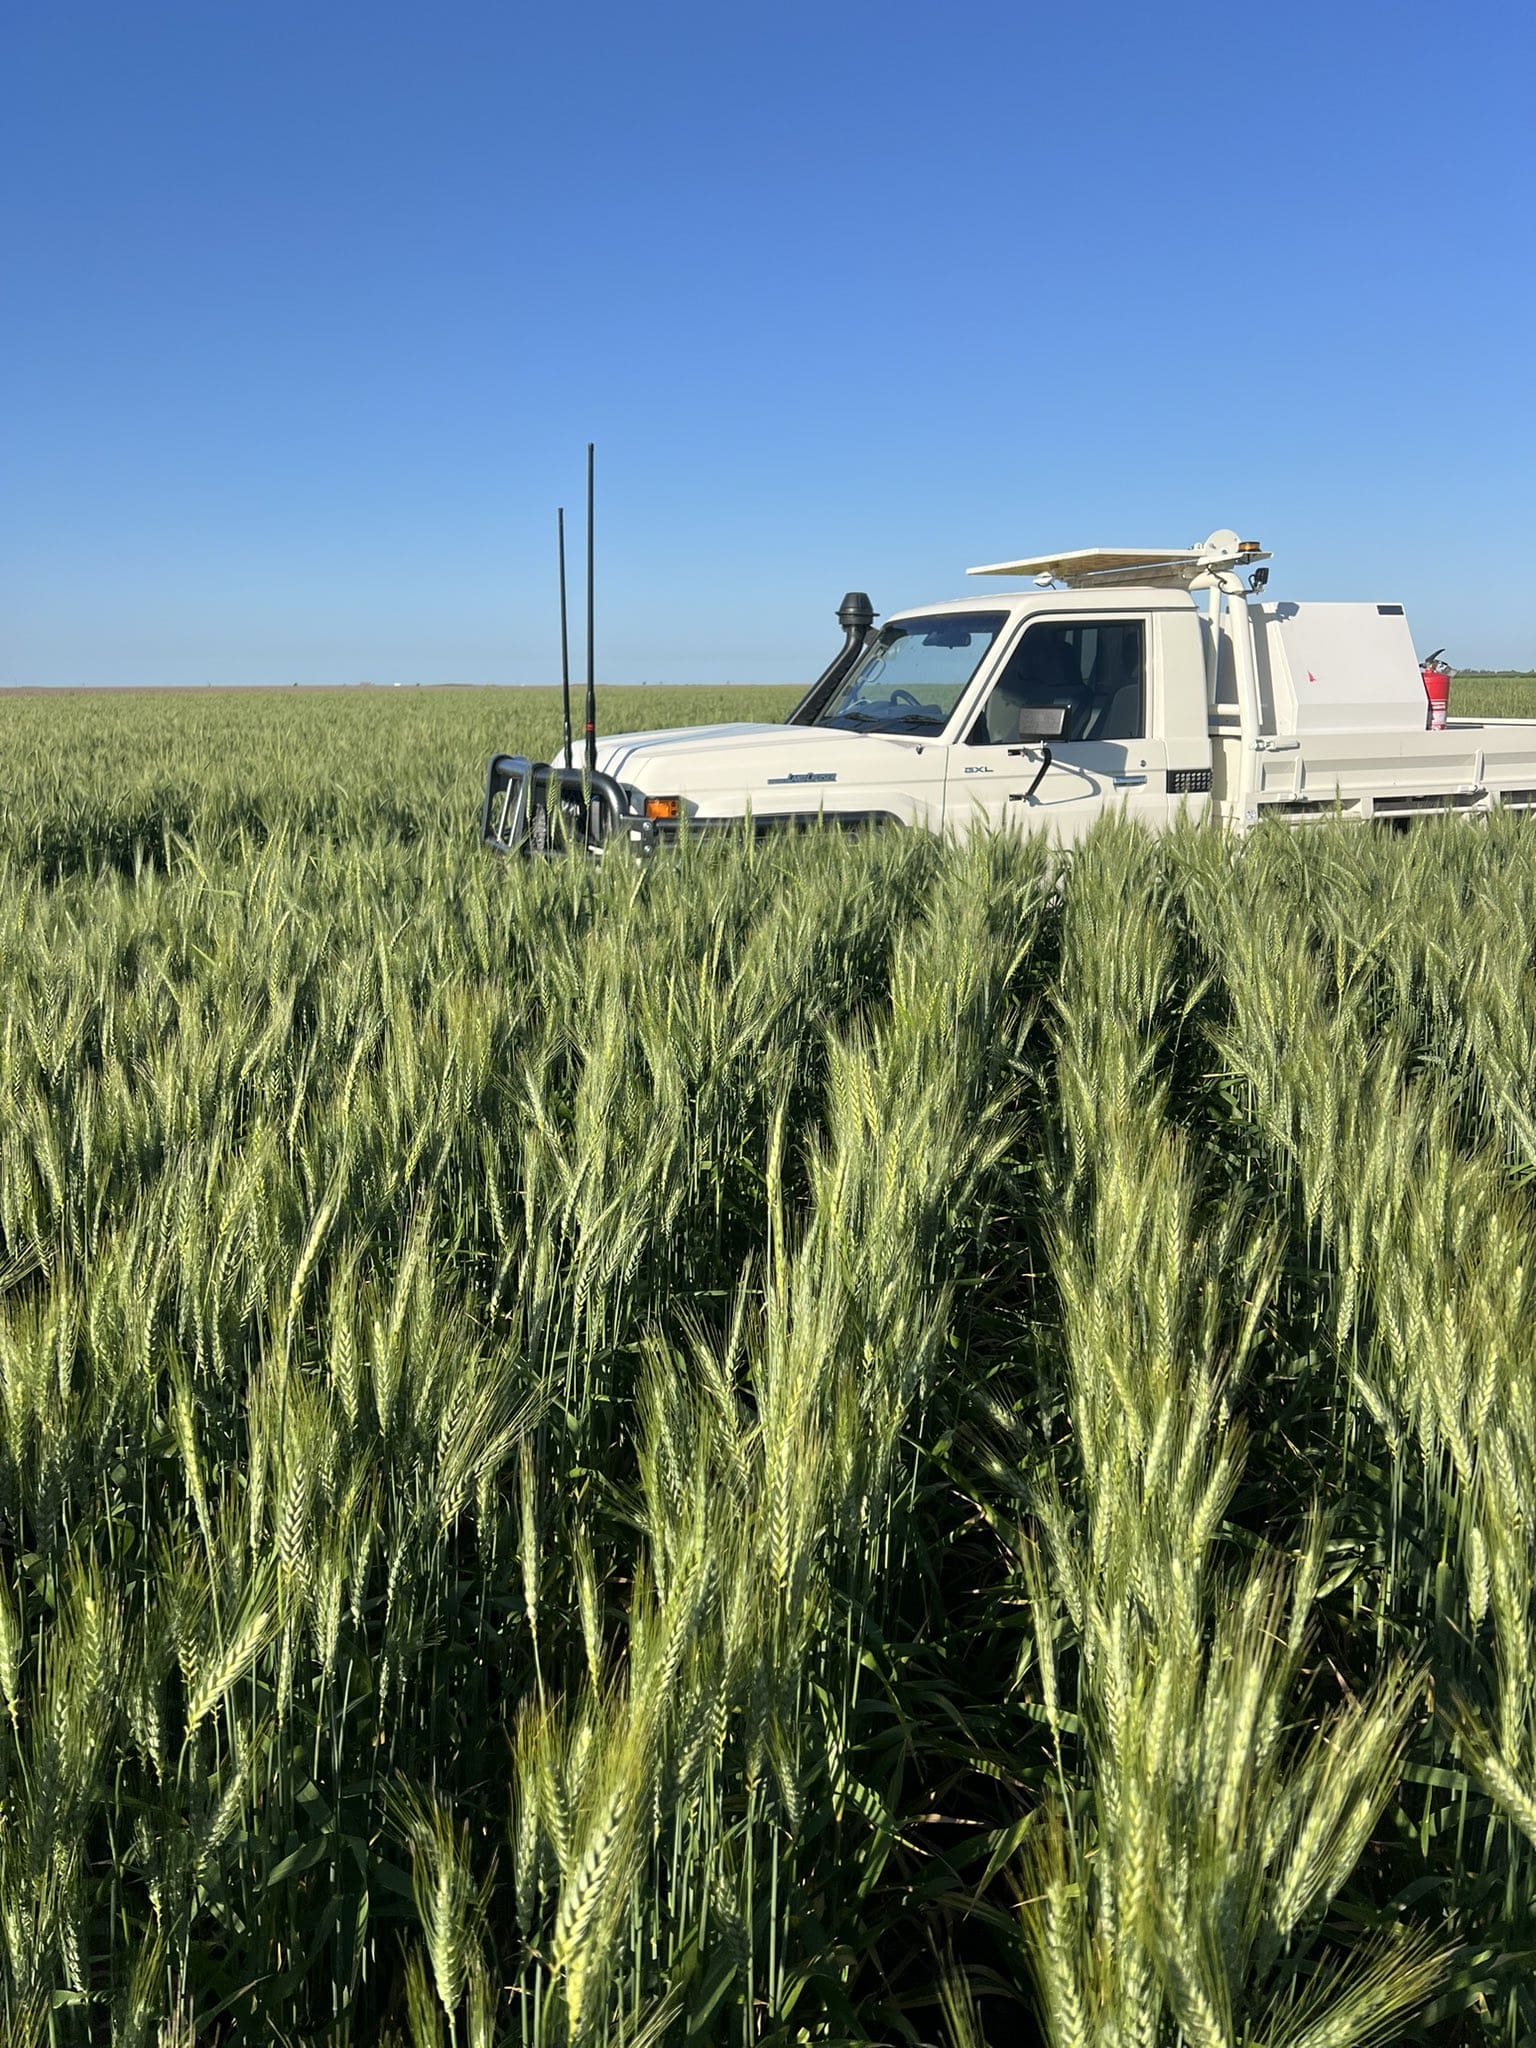
This crop of Hellfire wheat in northern NSW shows the best of the 2024-25 growing season. Photo: Andrew Uphill
AUSTRALIA is forecast to produce 31.8 million tonnes (Mt) of wheat, 12.2Mt of barley and 5.5Mt of canola from the winter crop now being sown.
The figures have been released today in ABARES September Australian Crop Report, which reveal the national forecaster’s revised estimates by commodity and state of production.
The wheat figure is up 9 percent from the intial estimate released in June of 29.1Mt, while the barley figure is up 6pc over the quarter from 11.5Mt, and canola is up 2pc from 5.4Mt.
“We have seen more favourable seasonal conditions across large parts of the country, easing input prices, and higher livestock prices supporting farm incomes” ABARES executive director Jared Greenville said.
However, the season is far from uniform.
“Crop production across Australia has been driven by New South Wales and Queensland, and better-than-expected seasonal conditions in Western Australia,” Dr Greenville said.
“But unfavourable conditions in north and western Victoria and most of South Australia following below average winter rainfall have resulted in lower-than-expected crop production.”
The mixed fortunes of the season can by seen in ABARES’ forecasts by state, with wheat and barley production estimates up for WA, Qld and NSW, but down in Vic and SA over the quarter.
Likewise, canola has seen a lift in NSW and WA, but drops in Vic and SA.
| WHEAT | Jun 2024-25 ha | Jun 2024-25 tns | Sep 2024-25 ha | Sep 2024-25 tns |
| Qld | 840,000 | 1,800,000 | 900,000 | 2,100,000 |
| NSW | 3,600,000 | 9,800,000 | 3,750,000 | 11,000,000 |
| Vic | 1,500,000 | 4,347,000 | 1,500,000 | 3,970,000 |
| Tas | 10,000 | 60,000 | 10,000 * | 60,000 * |
| SA | 2,100,000 | 4,590,000 | 2,100,000 | 4,300,000 |
| WA | 4,700,000 | 8,500,000 | 4,750,000 | 10,400,000 |
| TOTAL | 12,750,000 | 29,097,000 | 13,010,000 | 31,830,000 |
Table 1: Initial estimates released in June for Australia’s 2024-25 wheat area and tonnes produced, and revised estimates released today. * to be confirmed. Source: ABARES
| BARLEY | Jun 2024-25 ha | Jun 2024-25 tns | Sep 2024-25 ha | Sep 2024-25 tns |
| Qld | 170,000 | 450,000 | 180,000 | 510,000 |
| NSW | 870,000 | 2,500,000 | 980,000 | 2,800,000 |
| Vic | 850,000 | 2,492,000 | 820,000 | 2,400,000 |
| Tas | 6,000 | 30,000 | 6,000* | 30,000* |
| SA | 800,000 | 1,950,000 | 810,000 | 1,920,000 |
| WA | 1,650,000 | 4,100,000 | 1,650,000 | 4,500,000 |
| TOTAL | 4,346,000 | 11,522,000 | 4,446,000 | 12,160,000 |
Table 2: Initial estimates released in June for Australia’s 2024-25 barley area and tonnes produced, and revised estimates released today. * to be confirmed. Source: ABARES
| CANOLA | Jun 2024-25 ha | Jun 2024-25 tns | Sep 2024-25 ha | Sep 2024-25 tns |
| Qld | 5,000 | 8,000 | 5,000* | 8,000* |
| NSW | 830,000 | 1,600,000 | 900,000 | 1,800,000 |
| Vic | 520,000 | 1,057,000 | 520,000 | 950,000 |
| Tas | 2,000 | 4,000 | 2,000* | 4,000* |
| SA | 260,000 | 470,000 | 260,000 | 410,000 |
| WA | 1,550,000 | 2,250,000 | 1,550,000 | 2,300,000 |
| TOTAL | 3,167,000 | 5,385,000 | 3,237,000 | 5,472,000 |
Table 3: Initial estimates released in June for Australia’s 2024-25 canola area and tonnes produced, and revised estimates released today. * to be confirmed. Source: ABARES
Source: ABARES

HAVE YOUR SAY