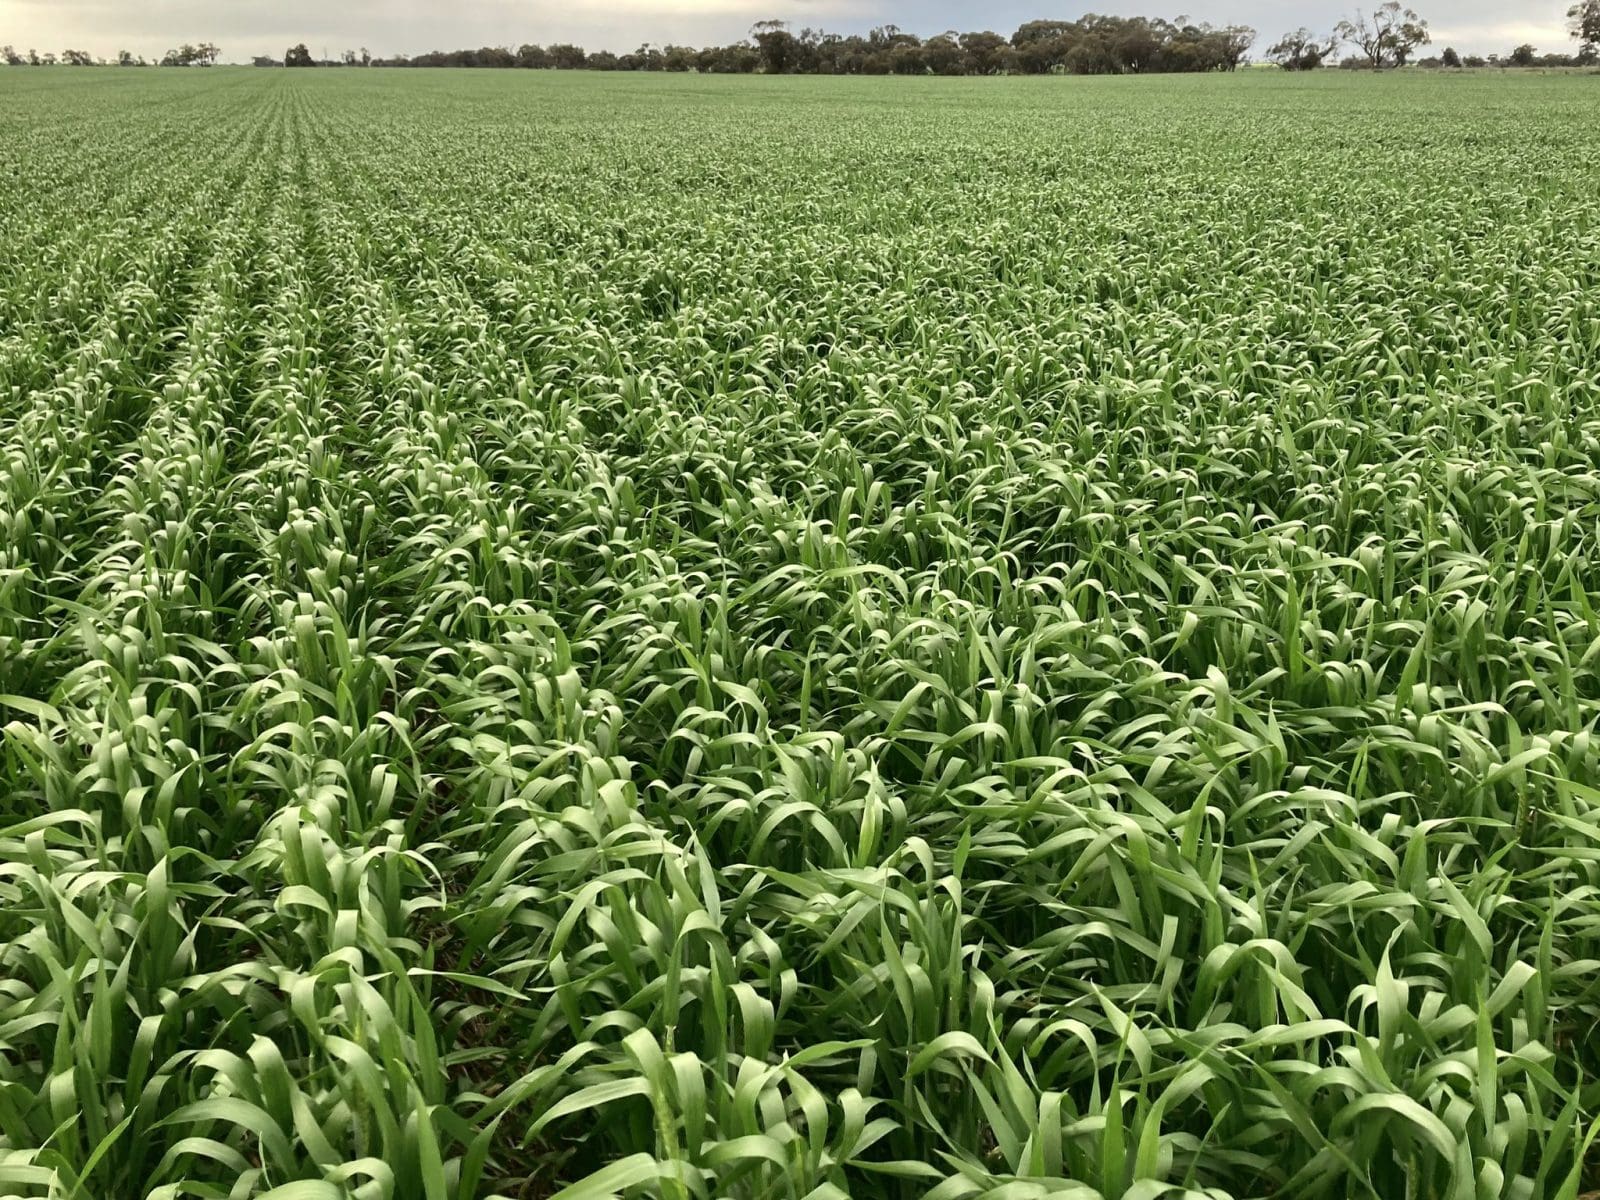
A crop of Calibre wheat with some early heads shows good yield potential in the Victorian Wimmera. Photo: Matt Rohde
NATIONAL commodity forecaster ABARES has cut its estimate for new-crop wheat production to 25.4 million tonnes (Mt) from 26.2Mt seen in June in its quarterly Australian Crop Report released today.
Barley production is now seen at 10.5Mt, up from 9.9Mt forecast in June, while the canola crop is expected to hit 5.2Mt, up from 4.9Mt forecast in the previous quarter.
In commentary tied to the report, ABARES said total Australian winter-crop production is forecast to fall 34 percent from the record 2022-23 level to 45.2Mt in 2023-24.
After three consecutive record years, this represents a small upwards revision from the June forecast but remains below the 10-year average to 2022-23 of 46.4Mt.
Australian winter-crop yields are also forecast to be below average owing to persistent dry conditions in key northern cropping regions, where a fall in expected yields in northern cropping regions is likely to be partially offset by better potential in southern regions.
Queensland has had below-average in-crop rainfall and soil moisture levels, and is looking at an unfavourable climate outlook.
In New South Wales, seasonal conditions have varied, with conditions in southern and central areas better than those in the north.
Victoria is the only mainland eastern state expected to produce a winter crop above the 10-year average, and by 14 percent, with above-average yields expected and favourable conditions across most regions.
South Australia’s crop is on track to produce a winter crop 4pc above the 10-year average, but its rapid development means there is increased concern for frost damage during the critical flowering and subsequent phase, which presents additional risk to the yield outlook.
In Western Australia, the winter crop is expected to come in 7pc below the 10-year average, largely because of unfavourable conditions at planting and establishment in the northern and eastern cropping regions.
The increased chance of WA’s drier and warmer spring conditions presents a downside risk for crops already experiencing moisture stress.
Late emergence and slow crop development are also expected to limit WA yield potential because of the increased risk of exposure to heat stress in spring.
| WHEAT TNS | 2021-22 | 2022-23 | 2023-24 Jun | 2023-24 Sep |
| Qld | 2,222,000 | 2,305,000 | 1,520,000 | 1,400,000 |
| NSW | 12,029,000 | 10,260,000 | 7,200,000 | 6,600,000 |
| Vic | 4,246,000 | 5,393,000 | 3,397,000 | 4,100,000 |
| SA | 4,750,000 | 7,350,000 | 4,510,000 | 4,700,000 |
| WA | 12,919,000 | 13,800,000 | 9,500,000 | 8,500,000 |
| Tas | 70,000 | 82,500 | 85,000 | 85,000 |
| Total | 36,236,000 | 39,190,500 | 26,212,000 | 25,385,000 |
Table 1: Australian wheat production estimates in tonnes and by state. Source: ABARES
| WHEAT HA | 2021-22 | 2022-23 | 2023-24 Jun | 2023-24 Sep |
| Qld | 941,000 | 980,000 | 920,000 | 900,000 |
| NSW | 3,608,000 | 3,600,000 | 3,510,000 | 3,300,000 |
| Vic | 1,445,000 | 1,500,000 | 1,540,000 | 1,540,000 |
| SA | 2,008,000 | 2,200,000 | 2,200,000 | 2,200,000 |
| WA | 4,718,000 | 4,750,000 | 4,650,000 | 4,650,000 |
| Tas | 9,300 | 15,000 | 15,000 | 12,000 |
| Total | 12,729,300 | 13,045,000 | 12,835,000 | 12,602,000 |
Table 2: Australian wheat area in hectares and by state. Source: ABARES
| BARLEY TNS | 2021-22 | 2022-23 | 2023-24 Jun | 2023-24 Sep |
| Qld | 617,000 | 403,000 | 310,000 | 310,000 |
| NSW | 3,562,000 | 2,278,000 | 1,810,000 | 1,680,000 |
| Vic | 2,271,000 | 2,896,000 | 1,865,000 | 2,250,000 |
| SA | 2,146,000 | 2,900,000 | 1,892,000 | 2,000,000 |
| WA | 5,758,000 | 5,600,000 | 4,000,000 | 4,200,000 |
| Tas | 24,000 | 60,500 | 50,000 | 50,000 |
| Total | 14,378,000 | 14,137,500 | 9,927,000 | 10,490,000 |
Table 3: Australian barley production estimates in tonnes and by state. Source: ABARES
| BARLEY HA | 2021-22 | 2022-23 | 2023-24 Jun | 2023-24 Sep |
| Qld | 207,000 | 136,000 | 150,000 | 150,000 |
| NSW | 1,159,000 | 780,000 | 840,000 | 800,000 |
| Vic | 870,000 | 820,000 | 830,000 | 830,000 |
| SA | 970,000 | 830,000 | 860,000 | 850,000 |
| WA | 1,884,000 | 1,550,000 | 1,600,000 | 1,600,000 |
| Tas | 4,300 | 11,000 | 10,000 | 7,000 |
| Total | 5,094,300 | 4,127,000 | 4,290,000 | 4,237,000 |
Table 4: Australian barley area in hectares and by state. * To be confirmed. Source: ABARES
| CANOLA TNS | 2021-22 | 2022-23 | 2023-24 Jun | 2023-24 Sep |
| Qld | 4,700 | 10,000 | 4,000 | 4,000 |
| NSW | 2,114,000 | 1,800,000 | 1,140,000 | 1,095,000 |
| Vic | 1,303,000 | 1,383,000 | 860,000 | 1,075,000 |
| SA | 435,000 | 770,000 | 413,000 | 475,000 |
| WA | 2,954,000 | 4,300,000 | 2,500,000 | 2,500,000 |
| Tas | 9,800 | 10,000 | 2,000 | 2,000 |
| Total | 6,820,500 | 8,273,000 | 4,915,000 | 5,152,000 |
Table 5: Australian canola production estimates in tonnes and by state. Source: ABARES
| CANOLA HA | 2021-22 | 2022-23 | 2023-24 Jun | 2023-24 Sep |
| Qld | 2,200 | 4,700 | 3,000 | 3,000 |
| NSW | 941,000 | 900,000 | 860,000 | 840,000 |
| Vic | 569,000 | 600,000 | 550,000 | 550,000 |
| SA | 222,000 | 290,000 | 275,000 | 285,000 |
| WA | 1,513,000 | 2,100,000 | 1,800,000 | 1,800,000 |
| Tas | 3,600 | 5,000 | 1,000 | 3,000 |
| Total | 3,250,800 | 3,899,700 | 3,486,000 | 3,481,000 |
Table 6: Australian canola area in hectares and by state. Source: ABARES
Source: ABARES
HAVE YOUR SAY