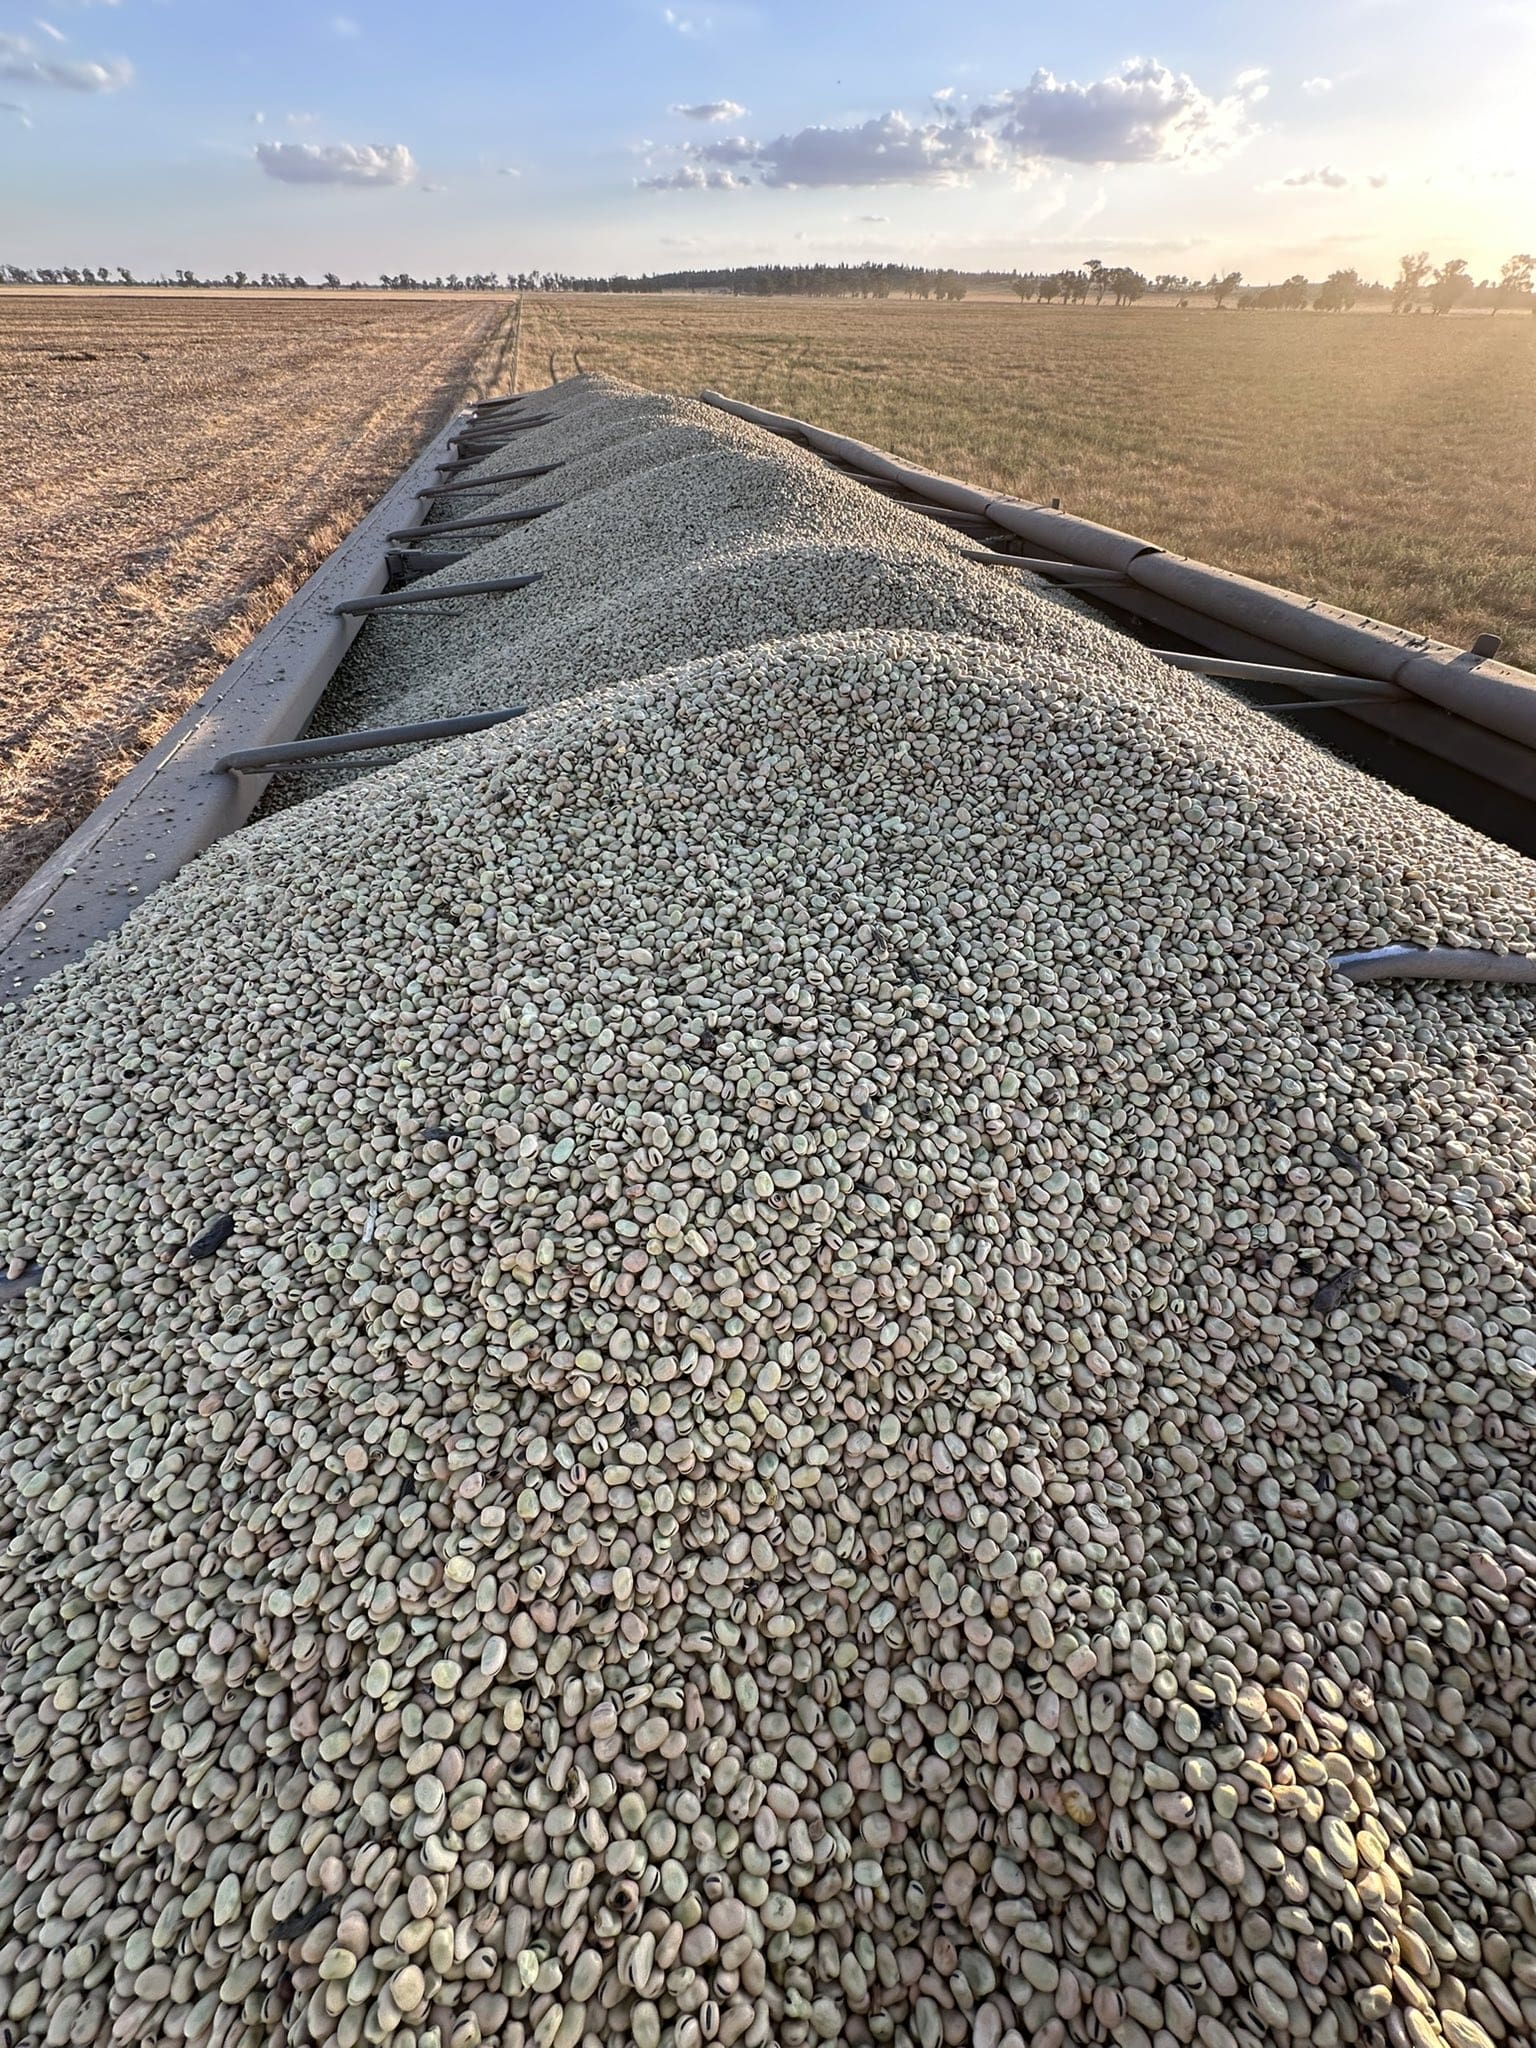
NSW is harvesting a record faba bean crop this season, as well as a record chickpea one. Pictured is a truck ready to haul out faba beans at Caragabal, south of Forbes. Photo: Grassroots Agronomy
THE forecast for Australia’s 2024-25 chickpea crop now being harvested has leapt from 1.3 million tonnes seen in September to 1.9Mt now, while the lentil estimate has dropped from 1.7Mt to 1.1Mt.
They are the standout figures in ABARES’ revisions to its estimates for Australia’s major pulse crops now being harvested, and released today in its quarterly Australian Crop Report.
The 42-percent gain for chickpeas against the 34pc drop for lentils highlights the favourable northern seeason, which saw big jumps in New South Wales and Queensland estimates for chickpeas, against slashes to Victorian and South Australian lentil production because of their tough spring.
On faba beans, upward revisions for production in all three eastern states have offset a 42pc drop in South Australia, with NSW forecast to produce a record 350,000t, more than double the previous record of 165,000t set in 2023-24.
A record chickpea crop is also forecast for NSW, which at 1.1Mt will break the 1Mt barrier for the first time to swamp its previous record crop of 792,000t grown in 2016-17.
Qld has just about finished harvesting its second-biggest chickpea crop of 750,000t, below the record 1.15Mt set in 2016-17.
On lentils, record planted area in Vic and SA of 430,000ha and 470,000ha respectively has helped to offset the challenging growing seasons in both states.
Rain in spring for Western Australian growing areas is largely behind the lift for the national lupin estimate, up 119,000t from the September estimate to 763,000t, with jumps in the NSW and WA forecasts more than offsetting cuts to SA and Vic.
| CHICKPEAS | Sep 2024-25 ha | Sep 2024-25 tns | Dec 2024-25 ha | Dec 2024-25 tns |
| Qld | 380,000 | 640,000 | 400,000 | 750,000 |
| NSW | 350,000 | 650,000 | 550,000 | 1,100,000 |
| Vic | 24,000 | 26,000 | 24,000 | 22,000 |
| SA | 10,000 | 11,500 | 10,000 | 9,000 |
| WA | 4,500 | 5,500 | 4,500 | 5,700 |
| TOTAL | 768,500 | 1,333,000 | 988,500 | 1,886,700 |
Table 1: Estimates revised in September for Australia’s 2024-25 chickpea area and tonnes produced, and latest estimates released today.
| FABA BEANS | Sep 2024-25 ha | Sep 2024-25 tns | Dec 2024-25 ha | Dec 2024-25 tns |
| Qld | 19,000 | 35,000 | 19,000 | 37,000 |
| NSW | 50,000 | 110,000 | 160,000 | 350,000 |
| Vic | 90,000 | 160,000 | 120,000 | 180,000 |
| SA | 90,000 | 190,000 | 90,000 | 110,000 |
| WA | 9,500 | 15,500 | 9,500 | 16,500 |
| TOTAL | 258,500 | 510,500 | 398,500 | 693,500 |
Table 2: Estimates revised in September for Australia’s 2024-25 faba bean area and tonnes produced, and latest estimates released today.
| FIELD PEAS | Sep 2024-25 ha | Sep 2024-25 tns | Dec 2024-25 ha | Dec 2024-25 tns |
| Qld | 0 | 0 | 0 | 0 |
| NSW | 44,000 | 45,000 | 50,000 | 65,000 |
| Vic | 40,000 | 58,000 | 40,000 | 40,000 |
| SA | 70,000 | 78,000 | 70,000 | 65,000 |
| WA | 33,000 | 48,000 | 33,000 | 52,000 |
| TOTAL | 187,000 | 229,000 | 193,000 | 222,000 |
Table 3: Estimates revised in September for Australia’s 2024-25 field pea area and tonnes produced, and latest estimates released today.
| LENTILS | Sep 2024-25 ha | Sep 2024-25 tns | Dec 2024-25 ha | Dec 2024-25 tns |
| Qld | 1,300 | 1,400 | 1,300 | 1,500 |
| NSW | 16,000 | 20,000 | 35,000 | 39,900 |
| Vic | 430,000 | 790,000 | 430,000 | 535,000 |
| SA | 470,000 | 860,000 | 470,000 | 525,000 |
| WA | 9,800 | 14,000 | 10,500 | 15,000 |
| TOTAL | 927,100 | 1,685,400 | 946,800 | 1,116,400 |
Table 4: Estimates revised in September for Australia’s 2024-25 lentil area and tonnes produced, and latest estimates released today.
| LUPINS | Sep 2024-25 ha | Sep 2024-25 tns | Dec 2024-25 ha | Dec 2024-25 tns |
| Qld | 1,500 | 3,000 | 1,500 | 3,000 |
| NSW | 50,000 | 70,000 | 90,000 | 125,000 |
| Vic | 35,000 | 39,000 | 35,000 | 30,000 |
| SA | 38,000 | 42,000 | 38,000 | 35,000 |
| WA | 330,000 | 490,000 | 350,000 | 570,000 |
| TOTAL | 454,500 | 644,000 | 514,500 | 763,000 |
Table 5: Estimates revised in September for Australia’s 2024-25 lupin area and tonnes produced, and latest estimates released today.
Source: ABARES
HAVE YOUR SAY