Top 10 cropping regions by change in NPP based on data captured on September 12. Source: DAS
DIGITAL Agricultural Services has released its first national public winter-crop growth snapshot by region to confirm that northern New South Wales is heading for a bumper season, and South Australia is heading for the opposite.
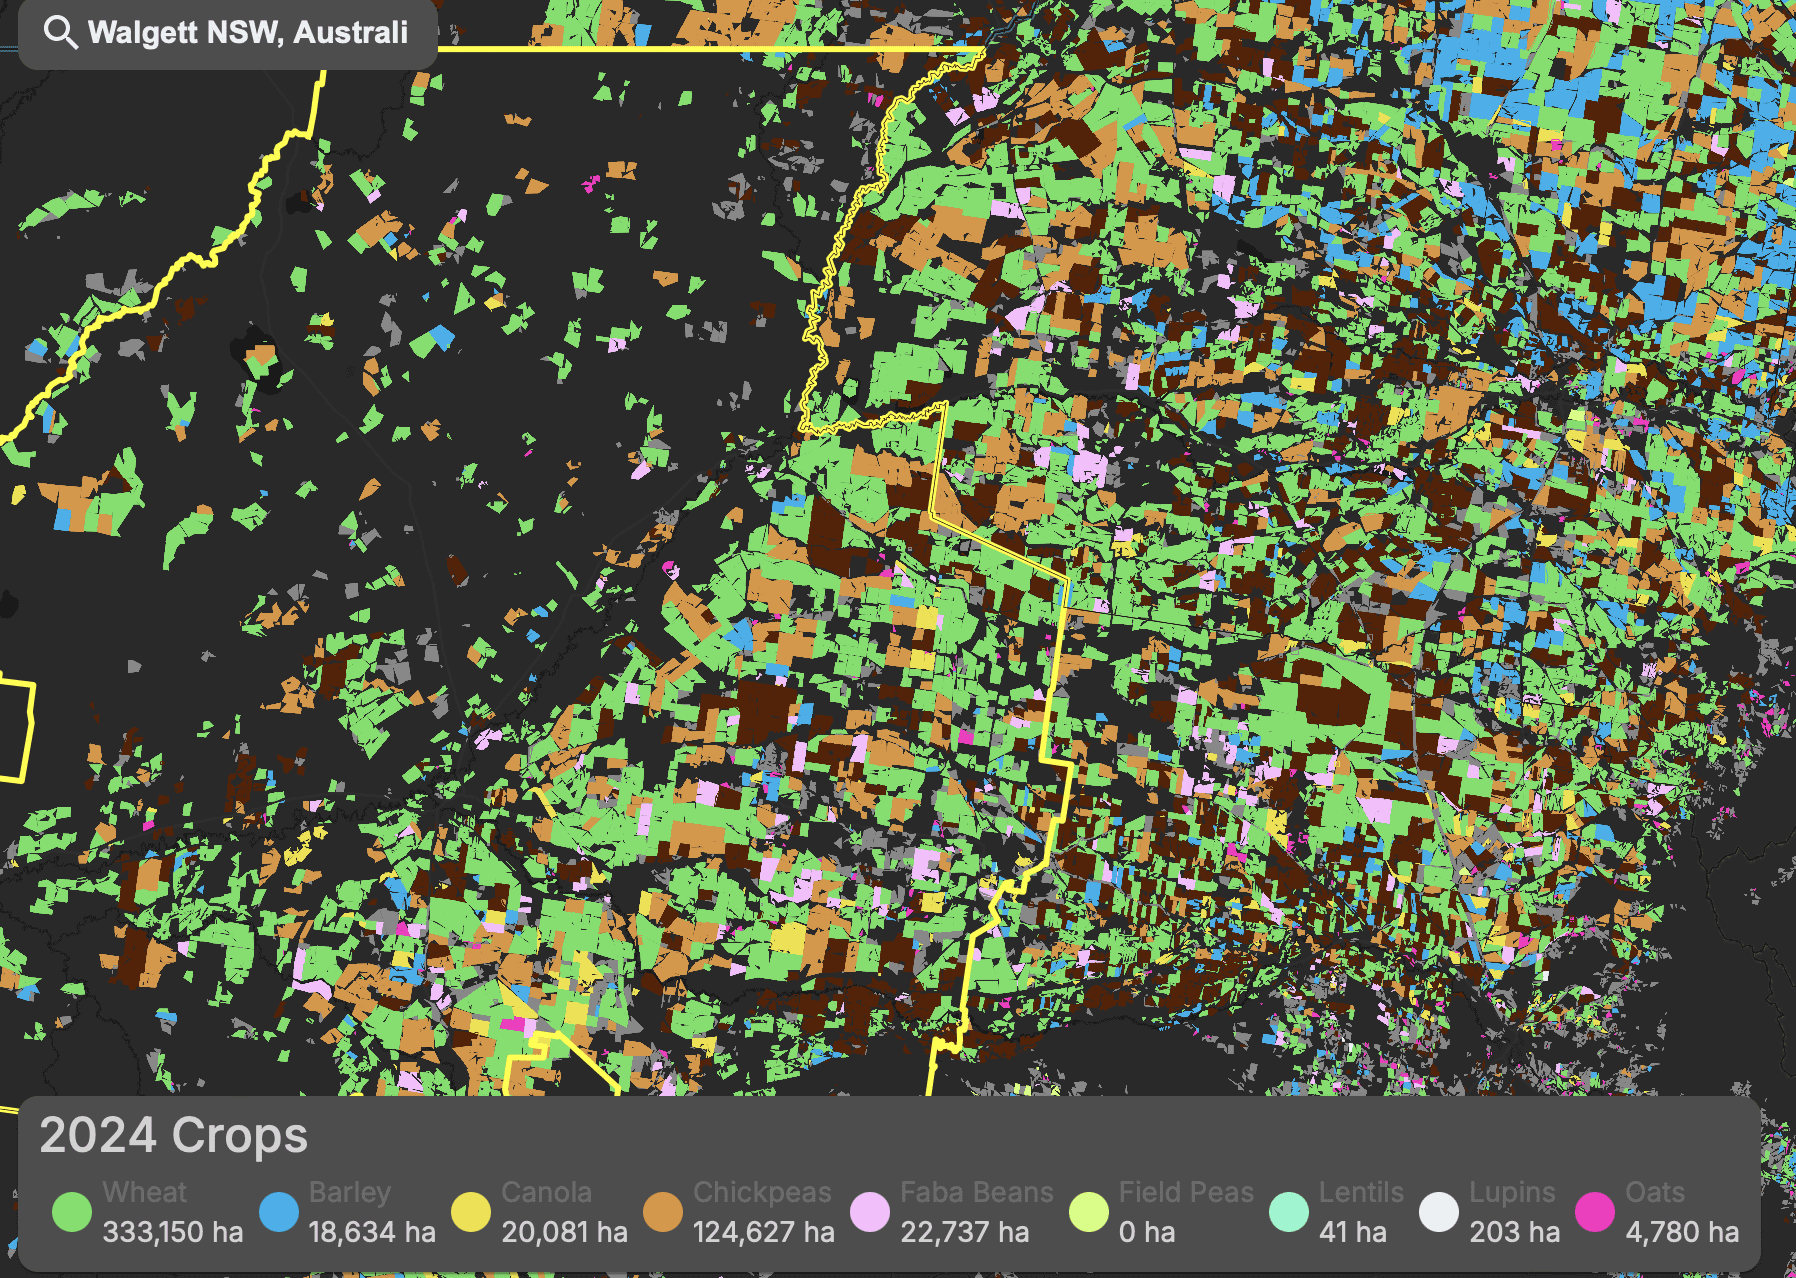
Using satellite technology and machine learning, and based on DAS’ Net Primary Productivity metric, a biophysical estimate of plant growth rate that correlates well with crop yield, Walgett in north-western NSW is sitting in the top spot for yield potential.
Northern NSW local government areas account for seven of the top 10 spots, with Queensland’s Balonne in third place, and Western Australia’s Mount Marshall and Narembeen in ninth and tenth place.
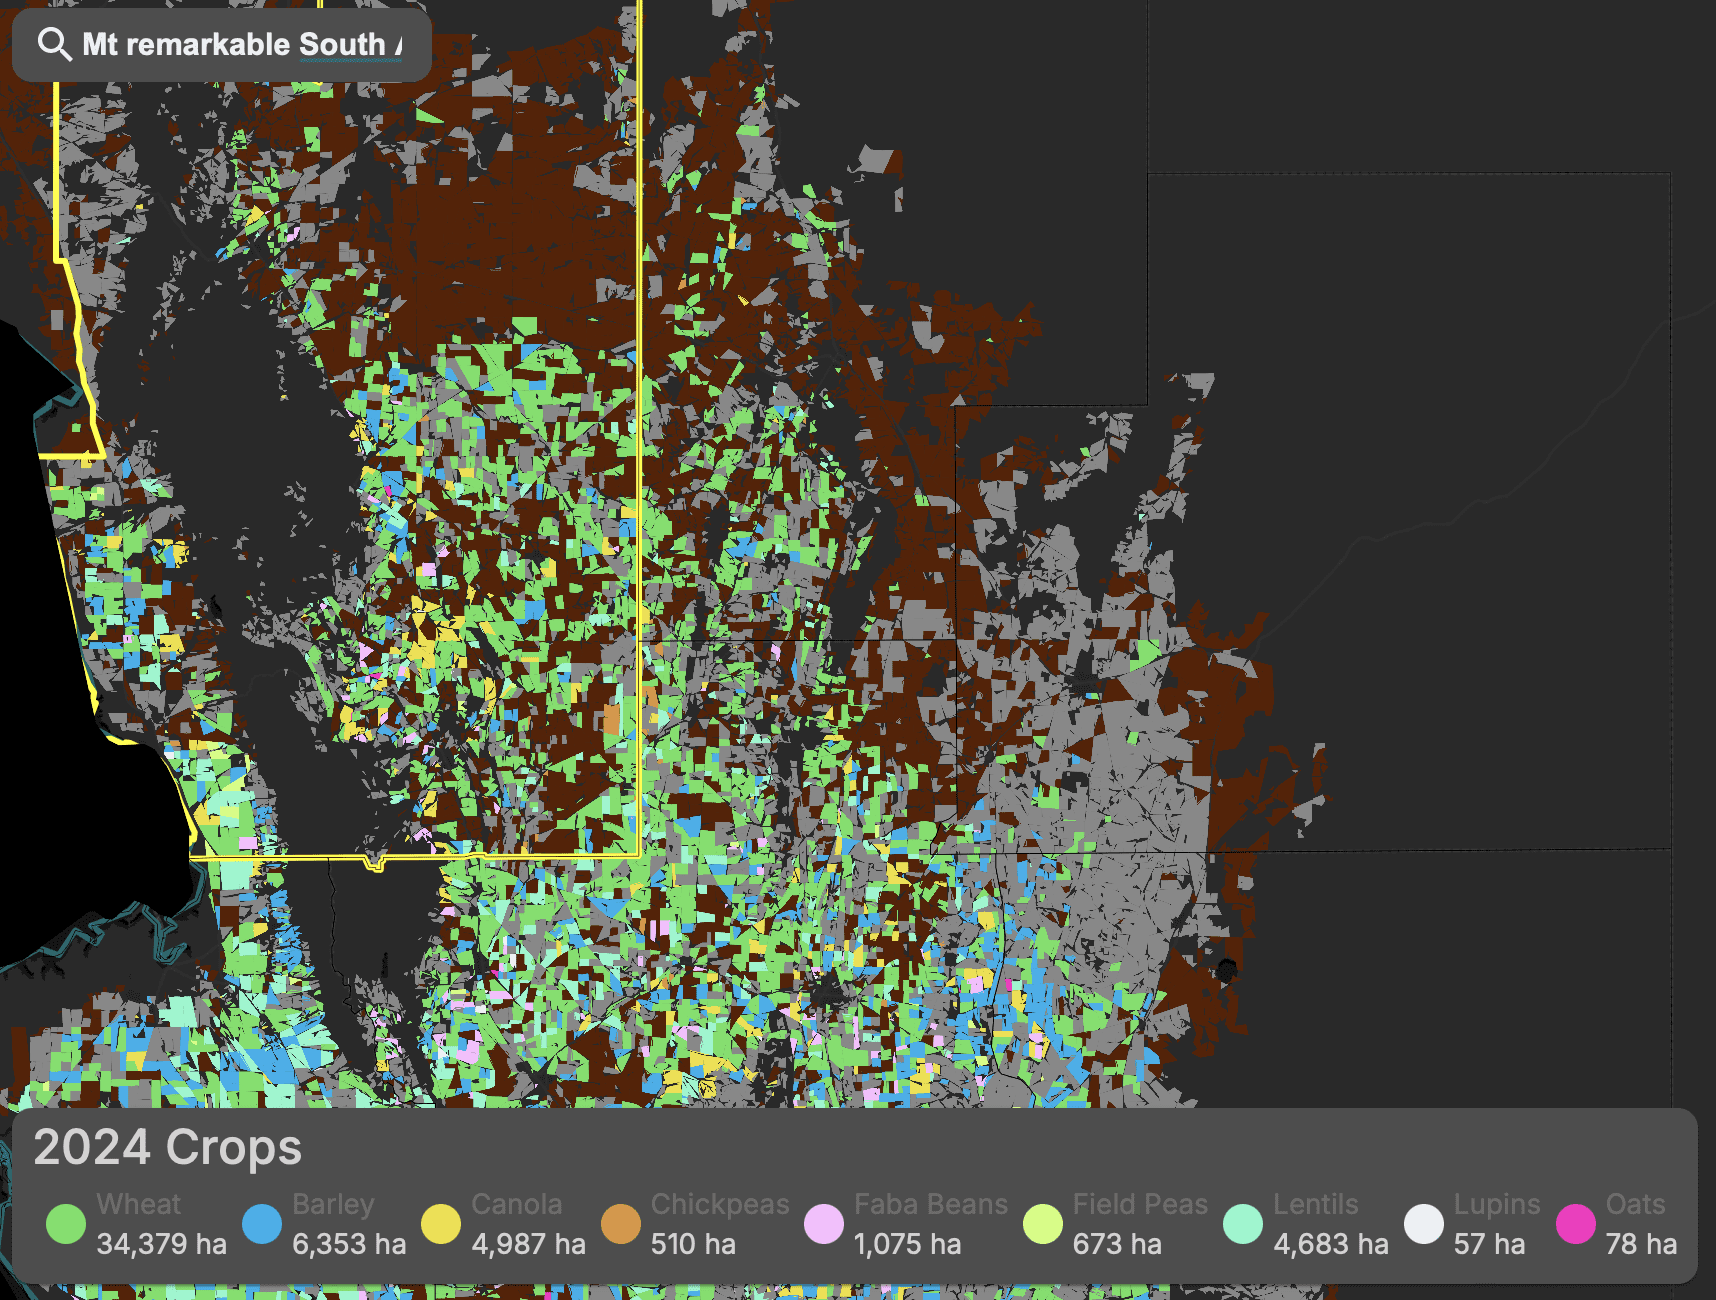
After a brutally dry growing season, and prior to a run of frosts, nine out of 10 of the lowest NPP regions are in South Australia, with Mount Remarkable in the Upper North and Streaky Bay on the western Eyre Peninsula looking like they will yield half their 10-year average.
Victoria’s Greater Geelong is in the only LGA outside SA to place in into the 10 lowest-ranking regions.
“High variance in rainfall across Australia has essentially made some of our lowest producing areas turn out a bumper crop, and our grain powerhouses regions hit record lows in terms of expected yield,” DAS chief executive officer and co-founder Anthony Willmott said.
The figures are one of DAS’ broader suite of Grain Intelligence reporting metrics, which provide granular estimates for crop area, yield, production, hay area and harvest progress.
| RANK |
LGA |
NPP | NPP 10-yr avg | Percentage above avg |
| 1 | Walgett, NSW | 2.26 | 0.99 | 103 |
| 2 | Moree Plains, NSW | 2.66 | 1.48 | 79 |
| 3 | Balonne, QLD | 0.99 | 0.53 | 79 |
| 4 | Coonamble, NSW | 2.55 | 1.53 | 66 |
| 5 | Tamworth Regional, NSW | 1.38 | 0.83 | 66 |
| 6 | Liverpool Plains, NSW | 1.78 | 1.07 | 66 |
| 7 | Inverell, NSW | 1.14 | 0.71 | 61 |
| 8 | Brewarrina, NSW | 0.90 | 0.59 | 53 |
| 9 | Mount Marshall, WA | 1.67 | 1.30 | 29 |
| 10 | Narembeen, WA | 3.70 | 3.05 | 21 |
Table 1: Top 10 cropping regions by change in NPP based on data captured on September 12. Source: DAS
The models are developed with more than 109,000 ground-truth locations, including more than 13,000 locations from 2024.
“The focused, regional data we’re releasing today is just a sample of what our platform is capable of producing, ”
“With climate change playing an escalating role in harvest variance and food security, many of our clients rely on our data to make decisions about harvesting and understand the market conditions for various crops at precise locations.
“We’ve seen this in today’s data.”
“More broadly, accurate crop predictions are critical for Australia, with the country consistently ranking as one of the top 10 global producers of critical commodities such as wheat, canola and barley.”
“Crop forecasting is a little predicting the weather.
“Thanks to advances in technology, it’s seen a massive step-change with our three and four-day forecasts now as accurate as our one-day forecasts were 30 years ago.
“In the same way, machine learning, earth observation, geospatial technology and remote sensing are today transforming the future of crop prediction for better food forecasts.”
| RANK | LGA | NPP | NPP 10-yr avg | Percentage below avg |
| 1 | Mount Remarkable, SA | 1.27 | 2.56 | -50 |
| 2 | Streaky Bay, SA | 1.37 | 2.77 | -50 |
| 3 | Murray Bridge, SA | 0.98 | 1.90 | -48 |
| 4 | Ceduna, SA | 1.09 | 2.09 | -46 |
| 5 | Port Pirie, SA | 2.16 | 3.33 | -35 |
| 6 | Greater Geelong, Vic | 1.48 | 2.29 | -35 |
| 7 | Franklin Harbour, SA | 1.14 | 1.64 | -31 |
| 8 | Wudinna, SA | 1.85 | 2.64 | -30 |
| 9 | Goyder, SA | 1.10 | 1.54 | -28 |
| 10 | Wakefield, SA | 3.16 | 4.12 | -23 |
Table 2: Bottom 10 cropping regions by change in NPP based on data captured on September 12. Source: DAS
DAS has been creating grain data for more than five years.
The data is used by grain traders, bulk-handlers, financial institutions, and insurance firms, and in the formulation of policy around food security and trade.

Yield potential for crops in SA’s Mt Remarkable LGA are half the 10-year average. Image: DAS
Source: DAS

HAVE YOUR SAY