
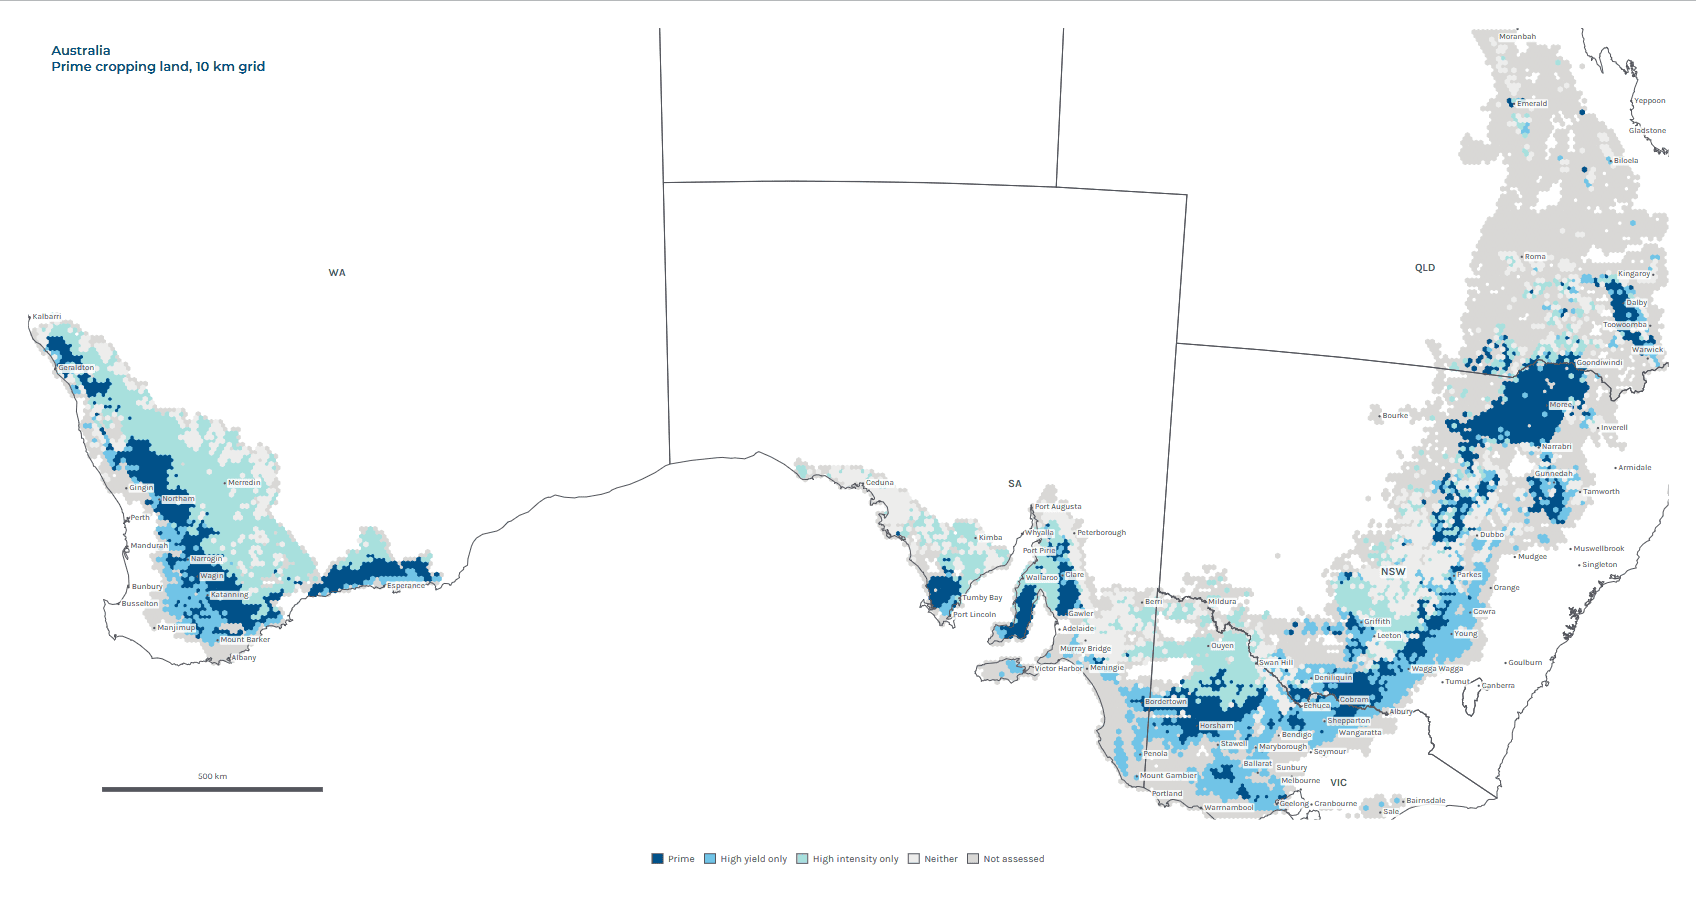
Prime cropping land shown in dark blue across the Australian grainbelt, and based on a 10km grid. Image: DAS
NEW national mapping by Digital Agriculture Services shows only 37 percent of Australia’s cropped land meets the dual test of consistently strong yields and frequent cropping.
The map highlights the concentration of the country’s most productive winter-cropping land, and defines prime cropping land as country that both yields well and crops often.
To qualify as prime cropping land, country needs a long-term wheat yield of 2.75 tonnes per hectare or more between 2018 and 2025, and a cropping intensity of at least 60pc of area carrying a winter or following summer crop in a typical year from 2021 to 2025.
The analysis identifies 9.7 million hectares (Mha) of prime cropping land nationally, 37pc of the 26.6Mha cropped across the country, and shows New South Wales holds the largest share with 3.4Mha.
DAS head of data science Sam Atkinson said the finding shows Australia’s best cropping country is far more concentrated than the size of the nation’s cropping footprint might suggest, and how closely it tracks rainfall.
“People talk about the wheatbelt as though it’s one thing, but it isn’t,” Mr Atkinson said.
LGA averages a mask
DAS uses AI and geospatial technology to record crop type and yield paddock by paddock, season by season, and connects that productivity history with climate data.
Its map to determine prime cropping country measured yields and cropping intensity within 10km hexagonal cells covering Australia’s grainbelt and aggregated to Local Government Areas (LGAs).
DAS analysis shows only 61pc of Australia’s prime cropping land sits inside the 46 LGAs that qualify as prime based on their whole-of-LGA averages, meaning the balance sits within districts that fall short on at least one of the two measures.
Mr Atkinson said the finding demonstrates the limitations of relying on broad geographic averages to understand individual areas of agricultural land.
“Climate and soils don’t align by local government area or postcode; an average across a whole district can conceal enormous differences in the paddocks and businesses inside it.”
DAS co-founder Sarah Gorman said the findings point to a much broader shift in how Australia can understand its agricultural land, and raise the question of why farms are still being surveyed for information that can increasingly be observed directly.
DAS’s latest analysis grew out of a bid to verify current public information on this unusual winter grain season, amid ongoing uncertainty around fertiliser supplies and a spike in global wheat prices.

Sarah Gorman.
“It is staggering to see how many decisions are being made off the back of literal guesswork or farmer surveys when the technology exists to accurately pinpoint what is growing in each paddock,” Ms Gorman said.
“Australia operates one of the most technologically advanced agricultural sectors in the world, with AI, satellite imagery and geospatial intelligence fundamentally shifting what we can know.
“We can increasingly see what is being grown, where it is being grown and how productive that land is, and make decisions about land-use based on data rather than assumptions.
“Technology is changing the nature of information itself, from periodic and aggregated to increasingly current, granular and location-specific.
“What’s more, this season should be a wake-up call to adjust our methods and leverage new technologies, especially as chronic climate change reshapes what is normal for agricultural production.”
DAS Grain Intelligence uses AI, satellite imagery and geospatial analytics to provide crop area, crop type, yield, production and harvest intelligence across Australia’s major cropping regions, supported by up to 20 years of historical productivity data.
Ms Gorman said the need for that intelligence increasingly extends beyond the farm gate.
“Farmers are flooded with on-farm technology, but the biggest decisions affecting the future of Australian agriculture are being made off-farm.
“The issue isn’t more data for data’s sake; iIt’s current, local, defensible location intelligence at the point a decision is being made, replacing assumptions and guesswork with evidence.
“Critically, much of that intelligence can now be generated without asking farmers to do anything more.
“The objective should be better intelligence with less reporting burden.”
Insights by state
New South Wales holds the most prime cropping country at 3.4Mha, followed by Western Australia on 3Mha, Victoria on 1.6Mha, South Australia on 1.1Mha million, and Queensland on 500,000ha.
NSW also has the highest share of any state, with 46pc of its cropped area classed as prime.
| State | Wheat yield | Cropping intensity | Cropped area | Prime area | Prime share of cropped area | Prime LGAs |
| NSW | 2.71t/ha | 56pc | 7.5Mha | 3.4Mha | 46pc | 11 |
| Qld | 2.37t/ha | 32pc | 2Mha | 0.5Mha | 26pc | 1 |
| SA | 2.19t/ha | 51pc | 4Mha | 1.1Mha | 27pc | 6 |
| Vic | 2.93t/ha | 54pc | 4.2Mha | 1.6Mha | 39pc | 4 |
| WA | 2.46t/ha | 70pc | 9Mha | 3Mha | 34pc | 24 |
| Australia | 2.57t/ha | 55pc | 26.6Mha | 9.7Mha | 37pc | 46 |
Table 1: State-based information from DAS mapping encompassing data from 2018 to 2025. Source: DAS
The largest continuous block runs across the north-west plains of NSW, from Walgett through Moree and Narrabri to Gunnedah and the Liverpool Plains, and north over the border to Goondiwindi and the Darling Downs.
In NSW, the region encompasses:
- Moree Plains: 839,000 ha of prime cropping land, 92pc of its cropped area and more than any other LGA in the country;
- Walgett: 337,000 ha, 77pc of its cropped area
- Narrabri: 267,000ha, 85pc of its cropped area
- Liverpool Plains: 77,900 ha, 74pc of its cropped area
Across southern Australia, prime cropping country is scattered over a wide area from WA’s Geraldton zone to NSW’s eastern Riverina, and includes:
- Vic: prime country is concentrated in the Wimmera and Southern Mallee, where Yarriambiack holds 348,000 ha
- SA: prime country runs from the lower Eyre Peninsula across to Yorke Peninsula, and through the Mid North; and,
- WA: the biggest block is on the south coast and Great Southern, with Esperance alone holding 444,000ha
Across the 46 prime LGAs, all averaging 2.75 t/ha or better over eight seasons, wheat yields were as low as 0.79t/ha in a single season, and 20 of the 46 held their worst-season yield at 2t/ha or above, with 14 of the 20 in WA.
Eight prime LGAs had yields which fell below 1t/ha, six of them in NSW, including Urana at 0.79t/ha in 2018 and Moree Plains at 0.86t/ha in 2019.
For 39 of the 46 districts, the worst season was 2018 or 2019, reflecting the severity of the drought across NSW and Qld.
Four recorded their worst season in 2024, namely Horsham in Vic which fell to 2.02t/ha, and three in SA: Lower Eyre Peninsula on 3.65 t/ha; Clare and Gilbert Valleys on 2.51t/ha, and Light on 2.01t/ha.
Because those droughts struck different states in different years, worst-season yields are not directly comparable between them.
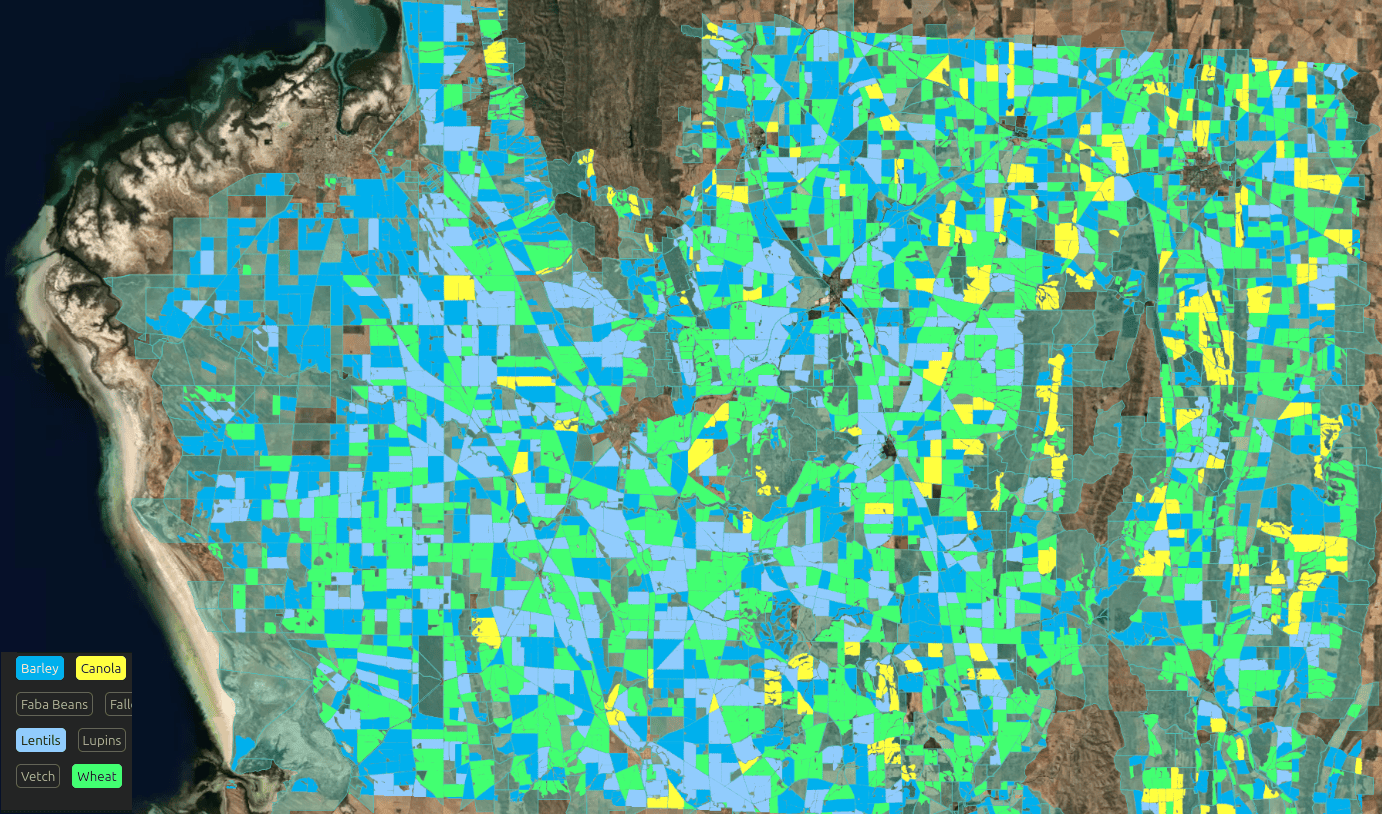
A section of SA’s grainbelt, with Port Broughton at bottom left, and stretching to the right through Gladstone into the Upper North to show crops by type in the ground this month. Photo: DAS
The gap between a long-term average and a worst season is what analysts call chronic climate risk, not a single bad year, but the way long-run rainfall and temperature patterns shift over time and change what a piece of country can reliably produce.
“An eight-year average tells you what land is capable of; it doesn’t tell you what happens to it in a bad year,” Mr Atkinson said.
“Moree Plains holds more prime cropping area than anywhere else in the country; even there, yield fell to 0.86t/ha in 2019.
“For a grower, a grain trader planning supply, a lender assessing default risk or an investor pricing an asset, that worst-year number is what they can plan around.”
The analysis measures wheat yield and cropping frequency only. It does not account for the yields of other significant crops such as cotton, or for profitability, soil type, rainfall or land value.
Ms Gorman said this was ultimately why more current agricultural intelligence mattered.
“Near real-time data isn’t valuable simply because it’s faster; it’s valuable because it can change a decision.
“Whether that decision is about grain availability, infrastructure, investment, risk or competing land use, the value of data is greatest before the decision is made, not a year afterwards.”
Source: DAS
HAVE YOUR SAY