
Parkes in the Central West of NSW, Photo: Parkes Shire Council
A NEW report has found rising wheat prices – influenced by growing conditions, seasonal timing and weather resilience – are translating into local economic prosperity and housing demand.
In Ray White’s latest regional report, group chief economist Nerida Conisbee found house prices in Australia’s wheatbelt surged 85 percent over the past decade, on the back of a 26pc rise in wheat prices.
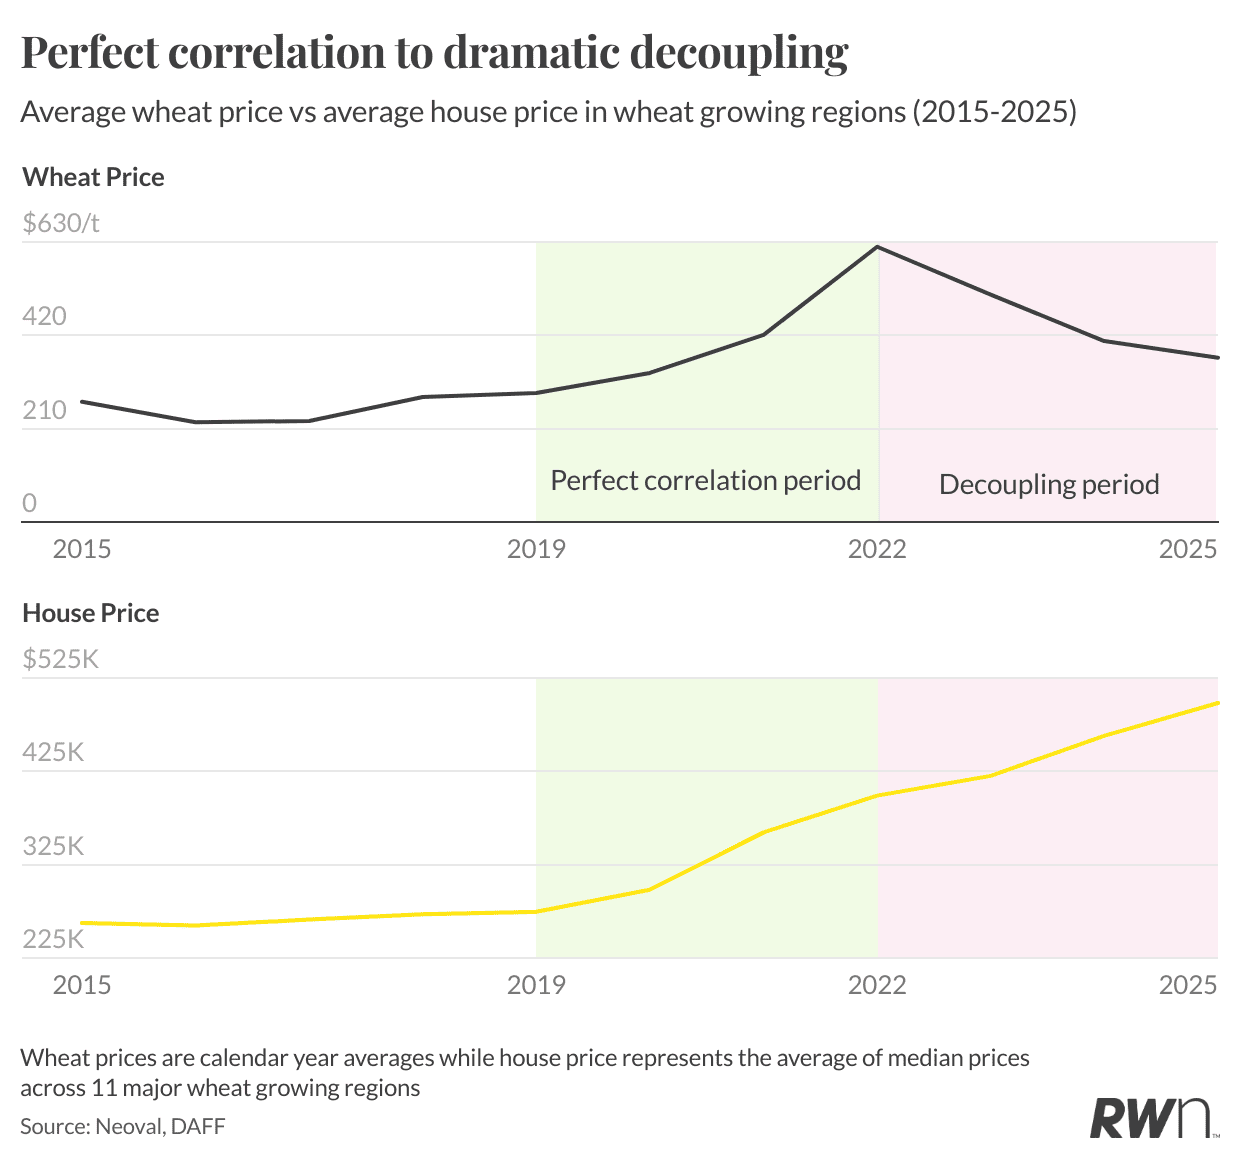
“In extraordinary periods, these markets move in perfect synchronisation – driven by weather booms that lift all regions simultaneously,” Ms Conisbee said in the report.
“This is followed by dramatic decoupling phases when broader economic forces like interest rates override agricultural fundamentals.”
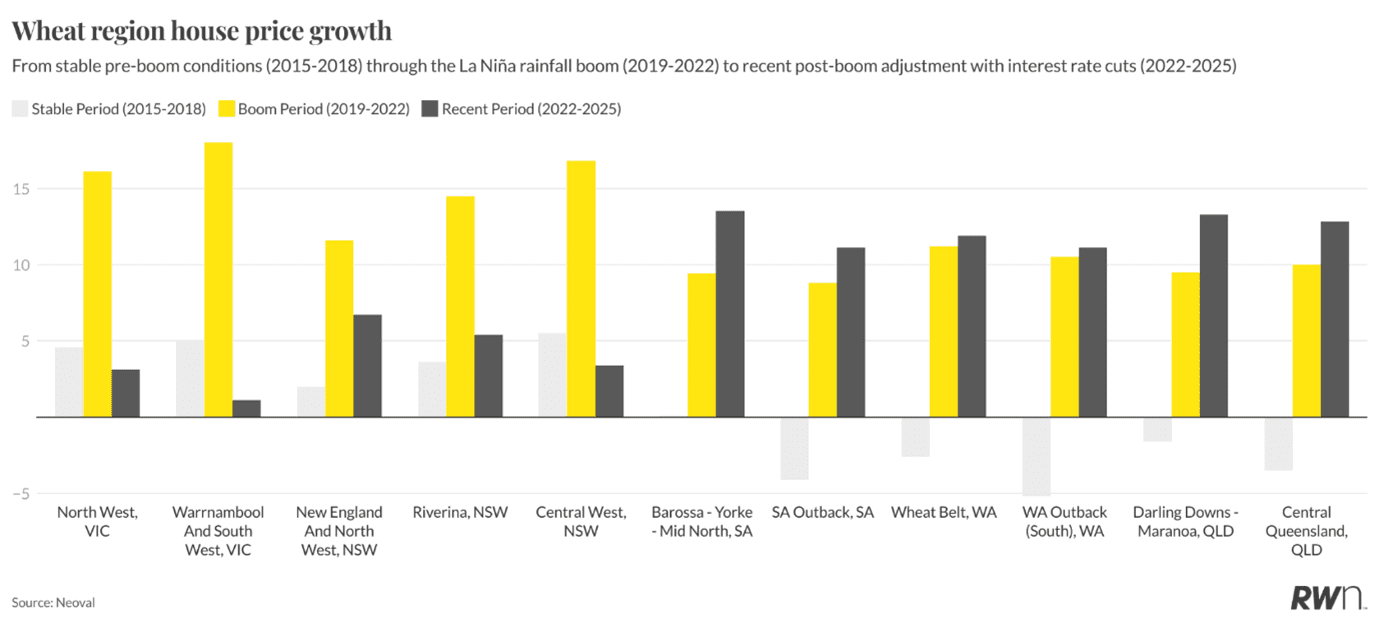
The above analysis examines 11 major wheat-growing regions across Australia from 2015 to 2025.
Ms Conisbee said over the past decade, wheat prices and house prices in growing regions have moved hand in hand.
“When wheat prices climbed 36 percent from $271 per tonne in 2015 to $369/t in 2025, average house prices across wheat regions surged 85pc.
“This connection makes economic sense: higher wheat prices mean better farm incomes, stronger rural economies, and increased demand for local housing.
“The relationship peaked during 2019-2022, when every single wheat growing region showed perfect correlation with commodity prices.
“During this period, wheat prices jumped from $290 to $619/t – a 114pc increase – while house prices across wheat regions rose from $275,000 to $399,000.”
Weather drives cycles

Nerida Conisbee.
Ms Conisbee said the correlation patterns align closely with Australia’s weather cycles, particularly La Niña and El Niño events.
“The 2019-2022 La Niña period brought exceptional rainfall across most wheat regions creating bumper harvests and synchronised prosperity.
“During these years, all 12 wheat growing regions moved in perfect lockstep with wheat prices.”
Ms Conisbee said since 2022, as weather patterns returned to normal variability, the correlations have shifted.
“Some regions now show negative correlations as wheat prices declined 33pc nt from their 2022 peak, while house prices continued rising on interest rate cuts and broader housing shortage pressures.”
Regional winners and losers
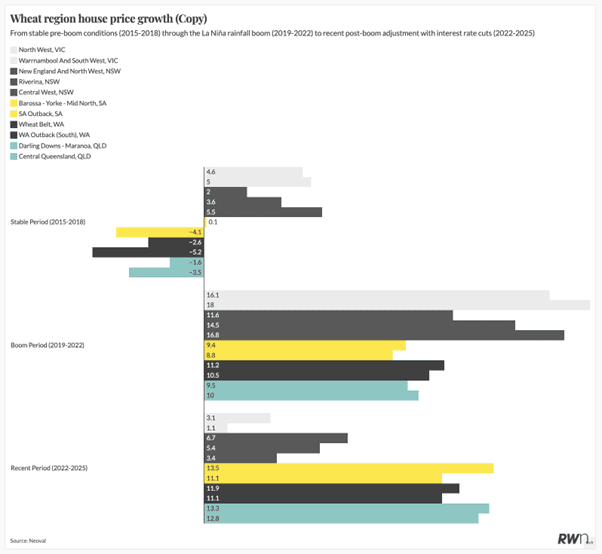
Ms Conisbee explained not all wheat regions respond equally to commodity price movements.
“Victorian regions like Warrnambool and the south-west show the strongest long-term correlations, while Queensland’s Central Queensland region demonstrates more resilience during downturns.”
She said NSW regions including the Central West, Riverina, and New England exhibit high sensitivity to wheat price swings but also show the most volatility.
“South Australian wheat regions display extreme sensitivity, swinging from very strong positive correlations during boom periods to equally strong negative correlations during adjustments.”
Ms Conisbee found WA wheat regions fall in the middle, showing moderate but consistent sensitivity to commodity cycles.
The current disconnect
According to Ms Conisbee, since 2022, a disconnect has emerged.
“Wheat prices have fallen from their $619 peak to $369 today, yet house prices in wheat regions continue climbing.
This reflects the broader housing market dynamics – interest rate cuts, supply shortages,
and lifestyle migration – now outweighing agricultural factors.”
However, Ms Conisbee said history suggests the disconnect may not last.
“Previous cycles show during stable wheat price periods, the correlation typically reasserts itself as other market forces moderate.”
Local weather trumps national wheat prices
While national wheat prices provide the headline figure, Ms Conisbee said local weather conditions determine whether individual regions benefit from commodity booms.
“Not all wheat regions move in sync with national prices because they may not be experiencing the same favourable growing conditions.”
“During the 2019-2021 La Niña period, exceptional rainfall benefited most regions simultaneously, explaining why all areas showed perfect correlation with wheat prices,” she said.
However, Ms Conisbee said as weather patterns returned to normal variability after 2022, regional differences emerged.
“Some areas continued to experience good growing conditions while others faced drought, flooding, or other challenges that disrupted their connection to national commodity trends.”
“Victorian regions, which include the reliable Wimmera and Mallee districts, tend to show more consistent correlations partly due to their relatively stable rainfall patterns and established irrigation infrastructure,” Ms Conisbee explained.
In contrast, she said the more weather-dependent rain-fed regions of New South Wales and South Australia exhibit stronger correlations during boom periods but also greater volatility when conditions turn.
“Queensland’s wheat regions operate on different seasonal cycles and face different weather systems altogether, which helps explain their more moderate correlation patterns.
Western Australian regions fall somewhere in between, with their Mediterranean climate providing reasonable reliability but still subject to significant year-to-year variation,”
said Ms Conisbee.
Grain Central: Get our free news straight to your inbox – Click here
HAVE YOUR SAY