HEFTY cereals supply worldwide is the main factor trimming the food import bill to a six-year low, according to the Rome-based Food and Agriculture Organisation (FAO) report released last night.
The total value of food imports worldwide is estimated to be US$1168 million, down 11 per cent from 2015.
Chicago wheat and corn prices are 16pc lower since the start of the year and rice price quotes are at their lowest level since January 2008.
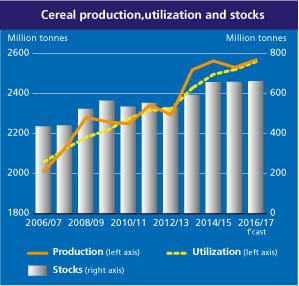
Plenty of stock is coming into grain stores (2,569 million tonnes of cereals) in a year of record global forecast for wheat crop and all-time high rice production.
Lower prices will drive consumption up too
Global cereals utilisation in 2016/17 is projected to expand by 1.6pc to 2,560 million tonnes, with feed usage, in particular, seen increasing by 2.7pc in 2016/17, amid large supplies of maize and low-quality wheat.
In spite of the projected year-on-year growth in total cereals utilisation, the rise in world cereals production in 2016 would still result in an increase in the level of global cereals year-end inventories, 659.9mmt, of which wheat, at 234.2mmt, will be around 9mmt higher than in 2015.
Inventories of coarse grains and rice are anticipated to slide below their opening levels.
Total wheat utilisation is projected to reach 730.5mmt (previous year 715.7), including a big jump in use of lower-quality wheat for animal rations.
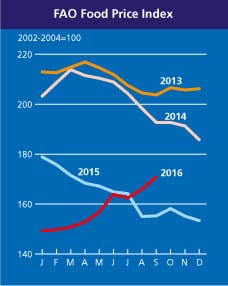
The FAO Food Price Index, which was also released overnight, is a measure of the monthly change in international prices of a basket of food commodities.
The index, pictured above, a composite of indices for cereals, vegetable oils, dairy, meat and sugar, consists of the average of the five commodity groups, weighted with the average export shares of each of the groups for 2002-2004.
It has been going up steadily since the start of the year, mainly supported by a surge in sugar prices and more moderate increases for dairy products, meat and oils, having declined for most of 2014 and 2015.
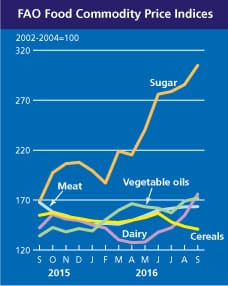
Sugar price rises have had a big effect on the index this past year, but especially since February, picture at right.
The vegetable oil and dairy indices were up, while meat was virtually unchanged this month, though since January’s five-year low it had risen by 12.6pc.


HAVE YOUR SAY