DRY WEATHER saw Canadian farmers cut 2017 yield and production estimates of major export crops canola, wheat and barley in the Statistics Canada (Statscan) crop report released on August 31.
The yield of Canada’s canola crop was forecast down 24 per cent in spite of a substantial lift in area planted. Canola production was forecast at 18.2 million tonnes (Mt), 7pc less than 2016.
The report said national wheat harvest area should remain similar to last year, but expected yields down 20pc would produce a below average wheat crop of 25.5Mt. Last year it was 31.7Mt.
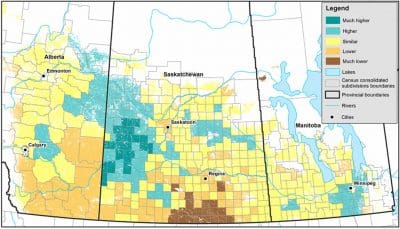
The crop report was derived from data from farm surveys conducted during July in a period of very dry conditions in southern parts of the Prairies, heavily cutting yield expectations in Saskatchewan province.

Figure 1: Canada vegetation growth index during survey collection period July 24-31 compared with past 30 year average. (Source: Statistics Canada)
Barley production was forecast down 18pc to 7.2Mt, as a result of lower harvested area and yield.
Oat production would rise 15pc to 3.7Mt on higher harvested area forecast and yield similar to 2016.
Also higher were the estimates for soybean output, another record 7.7Mt, and corn for grain, 13.6Mt, rises of 20pc and 3pc respectively.
What does this mean for Australian grains?
Traders in Australia told Grain Central that Canada’s growing conditions were already factored into world market prices for crops such as wheat, canola and barley.
“The headlines continue to be grabbed by the Black Sea origins, where big crops such as Russia’s 80Mt wheat harvest are dominating exports and keeping a lid on the world wheat market,” Market Check manager strategy and managed programs Nick Crundall said.
Australia’s role in wheat export trade this year, especially in light of dryness in the north, would be to service any inelastic demand while also keeping domestic markets satisfied.
Canola could turn out to be the main news from the Statscan report; the unfolding combination of tight old crop supply in Canada, the disappointing Canadian yield forecast for 2017 and emerging Australian dryness and frost issues may keep upward pressure on canola prices.
View Statscan data table here
Source: Statistics Canada


HAVE YOUR SAY